OPEN-SOURCE SCRIPT
StratNinjaTable - Vertical
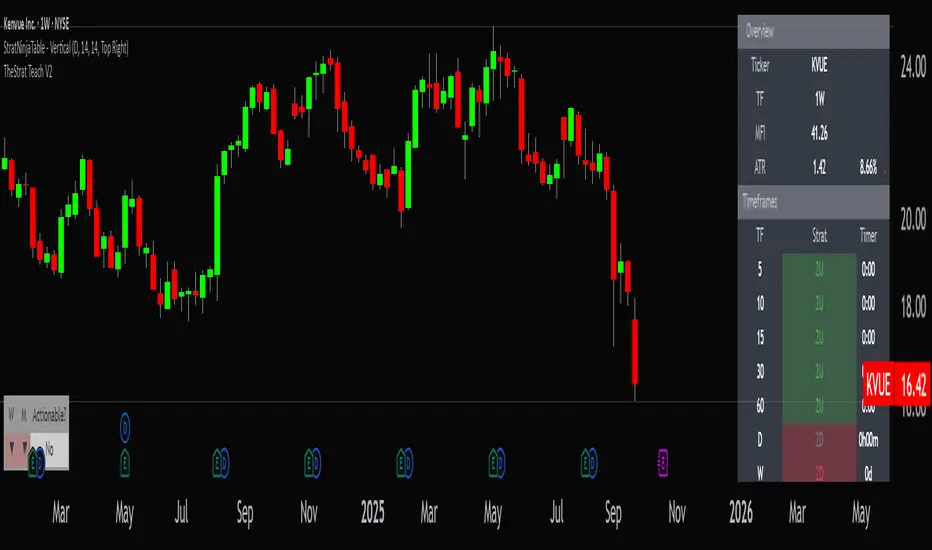
A Pine Script v6 indicator that displays a vertical table with key The Strat data and supporting metrics.
✦ Table Structure:
Overview:
Ticker – the stock symbol.
TF – the chart’s main timeframe.
MFI – Money Flow Index with selectable timeframe.
ATR – Average True Range with color coding:
Green – below 3%.
Yellow – between 3% and 6%.
Red – above 6%.
Timeframes:
Displayed vertically (5m, 15m, 1H, D, W, M, etc.).
Each shows the current bar type according to The Strat (1, 2U, 2D, 3).
Text color reflects candle direction (green = close above open, red = close below open).
Includes a countdown timer to bar close.
Fundamentals:
Market Cap – in billions.
Sector – stock sector.
SMA20 Δ – distance from the 20-period SMA (in %).
Avg Volume (30d) – average 30-day volume (in millions).
✦ Adjustments Made:
Removed the Strat Pattern section completely.
Removed the DIR column – direction is now represented by Strat cell text color.
Reordered Overview section: Ticker → TF → MFI → ATR.
ATR now has three levels of coloring (Green/Yellow/Red) for >3% and >6%
نص برمجي مفتوح المصدر
بروح TradingView الحقيقية، قام مبتكر هذا النص البرمجي بجعله مفتوح المصدر، بحيث يمكن للمتداولين مراجعة وظائفه والتحقق منها. شكرا للمؤلف! بينما يمكنك استخدامه مجانًا، تذكر أن إعادة نشر الكود يخضع لقواعد الموقع الخاصة بنا.
إخلاء المسؤولية
لا يُقصد بالمعلومات والمنشورات أن تكون، أو تشكل، أي نصيحة مالية أو استثمارية أو تجارية أو أنواع أخرى من النصائح أو التوصيات المقدمة أو المعتمدة من TradingView. اقرأ المزيد في شروط الاستخدام.