OPEN-SOURCE SCRIPT
Average True Range Overlay
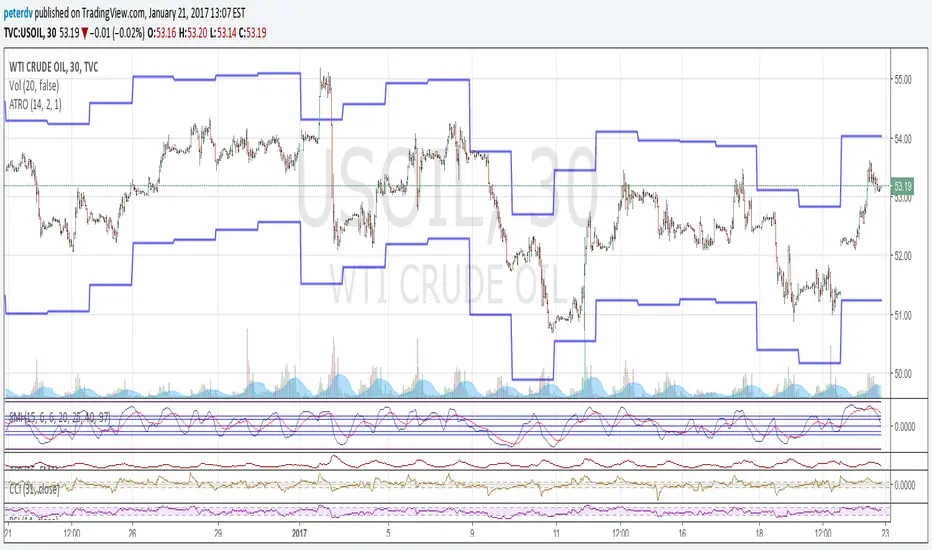
Plots ATR calculated on a daily basis as an overlay on the current chart.
Implemented using the builtin atr function.
ATR is a volatility indicator
originally developed by J. Welles Wilder, Jr. for commodities:
New Concepts in Technical Trading Systems. Greensboro, NC: Trend Research. ISBN 978-0-89459-027-6.
The range of a day's trading is simply R = high − low.
The true range extends it to yesterday's closing price if it was outside of today's range:
TR = max[(high-low), abs(high-close(previous)), abs(low - close(previous))]
The average true range is an N-day smoothed moving average of the TR values.
A first stab at a sensible stop loss level might be 3*ATR below recent peak.
نص برمجي مفتوح المصدر
بروح TradingView الحقيقية، قام مبتكر هذا النص البرمجي بجعله مفتوح المصدر، بحيث يمكن للمتداولين مراجعة وظائفه والتحقق منها. شكرا للمؤلف! بينما يمكنك استخدامه مجانًا، تذكر أن إعادة نشر الكود يخضع لقواعد الموقع الخاصة بنا.
إخلاء المسؤولية
لا يُقصد بالمعلومات والمنشورات أن تكون، أو تشكل، أي نصيحة مالية أو استثمارية أو تجارية أو أنواع أخرى من النصائح أو التوصيات المقدمة أو المعتمدة من TradingView. اقرأ المزيد في شروط الاستخدام.