OPEN-SOURCE SCRIPT
تم تحديثه SMA 119
Sometimes simplicity is a key.
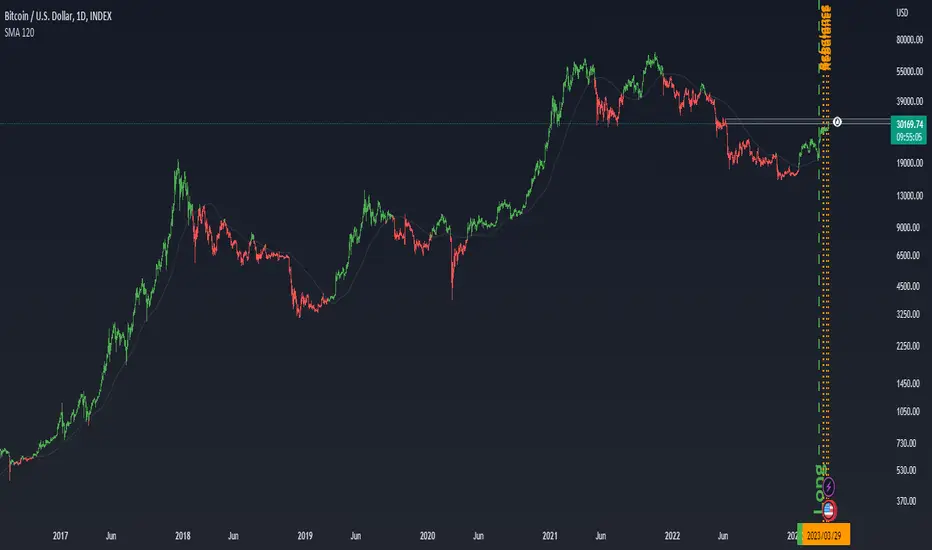
This is a Simple Moving Average of 119 period on daily timeframe.
When hl2 of price is above SMA it plot green candles (up trend), when below it plot red candles (down trend)
So it shows you a long term direction of BTC
It is very useful indicator to see in what stage BTC is now, Bear or Bull. Yes it seems to be very simple, but it works.
Sometimes to dig a hole, you dont need an excavator you just need an shovel. In this case shovel is a SMA =)
BackTest of indicator
https://www.tradingview.com/x/boR3okbF
ملاحظات الأخبار
-نص برمجي مفتوح المصدر
بروح TradingView الحقيقية، قام مبتكر هذا النص البرمجي بجعله مفتوح المصدر، بحيث يمكن للمتداولين مراجعة وظائفه والتحقق منها. شكرا للمؤلف! بينما يمكنك استخدامه مجانًا، تذكر أن إعادة نشر الكود يخضع لقواعد الموقع الخاصة بنا.
إخلاء المسؤولية
لا يُقصد بالمعلومات والمنشورات أن تكون، أو تشكل، أي نصيحة مالية أو استثمارية أو تجارية أو أنواع أخرى من النصائح أو التوصيات المقدمة أو المعتمدة من TradingView. اقرأ المزيد في شروط الاستخدام.
نص برمجي مفتوح المصدر
بروح TradingView الحقيقية، قام مبتكر هذا النص البرمجي بجعله مفتوح المصدر، بحيث يمكن للمتداولين مراجعة وظائفه والتحقق منها. شكرا للمؤلف! بينما يمكنك استخدامه مجانًا، تذكر أن إعادة نشر الكود يخضع لقواعد الموقع الخاصة بنا.
إخلاء المسؤولية
لا يُقصد بالمعلومات والمنشورات أن تكون، أو تشكل، أي نصيحة مالية أو استثمارية أو تجارية أو أنواع أخرى من النصائح أو التوصيات المقدمة أو المعتمدة من TradingView. اقرأ المزيد في شروط الاستخدام.