PROTECTED SOURCE SCRIPT
تم تحديثه Market Strength
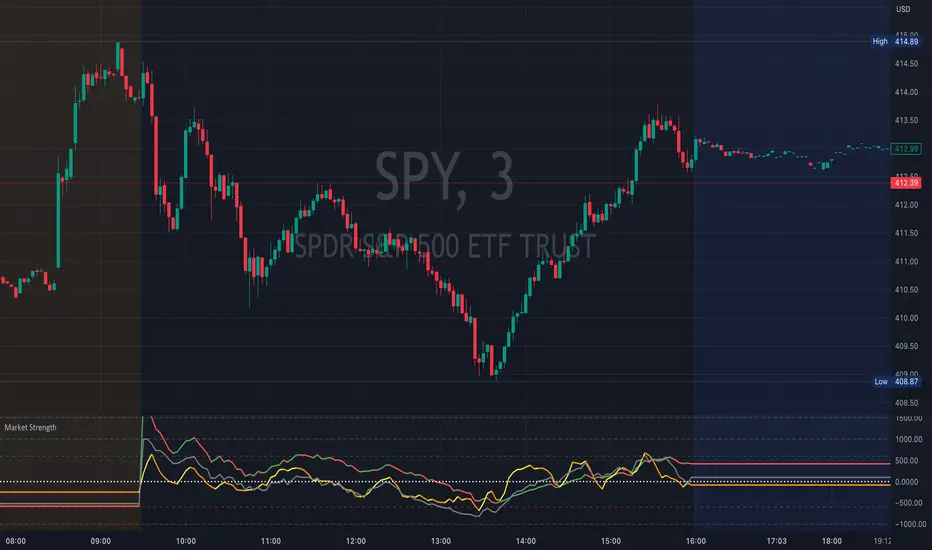
This indicator tracks  ADD, TICK, VVOLD on the chart while sharing the same space. This allows you to watch these important indicators without the need to give up separate dedicated space for each of them.
ADD is the number of NYSE stocks advancing vs declining
TICK is the number NYSE stocks trading on an uptick vs downtick
VVOLD is the NYSE Volume Difference and is the difference between the up volume and down volume
Zero is considered to be the pivot. The more positive the values, the more bullish in nature, while the more negative the values, the more bearish in nature.
When these are at an extreme, they indicate a possible market trend while smaller directional changes may foreshadow a market move in that direction.
If you like the indicator, please like and share!
Thank you!
ملاحظات الأخبار
VOLD label fixedنص برمجي محمي
تم نشر هذا النص البرمجي كمصدر مغلق. ومع ذلك، يمكنك استخدامه بحرية ودون أي قيود - تعرف على المزيد هنا.
إخلاء المسؤولية
لا يُقصد بالمعلومات والمنشورات أن تكون، أو تشكل، أي نصيحة مالية أو استثمارية أو تجارية أو أنواع أخرى من النصائح أو التوصيات المقدمة أو المعتمدة من TradingView. اقرأ المزيد في شروط الاستخدام.
نص برمجي محمي
تم نشر هذا النص البرمجي كمصدر مغلق. ومع ذلك، يمكنك استخدامه بحرية ودون أي قيود - تعرف على المزيد هنا.
إخلاء المسؤولية
لا يُقصد بالمعلومات والمنشورات أن تكون، أو تشكل، أي نصيحة مالية أو استثمارية أو تجارية أو أنواع أخرى من النصائح أو التوصيات المقدمة أو المعتمدة من TradingView. اقرأ المزيد في شروط الاستخدام.