OPEN-SOURCE SCRIPT
Hersheys CoCo Volume
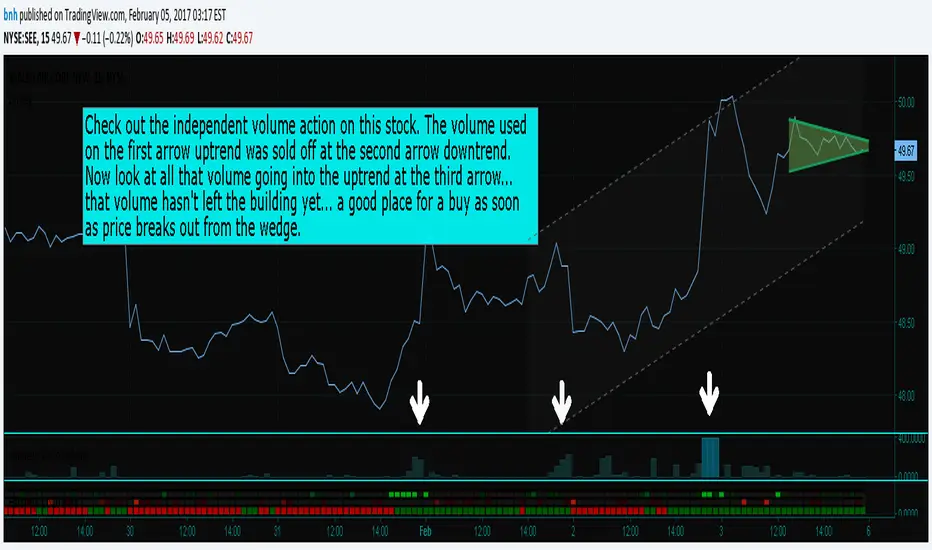
CoCo Volume shows you volume movement of your symbol after subtracting the movement from another symbol, preferrably the sector or market the stock belongs to.
My latest update to my CoCoVolume Indicator. It calculates today's volume percent over the 60 period average for both your symbol and index, and displays that difference. If the percent is over the max it highlights the color, showing BIG action for that stock.
The last version was calculating the percent volume difference from yesterday to today for the stock and index and displaying the difference. The prior method had large swings on low volume stocks... this one shows the independent volume action much better. The default values will suit most stocks.
You can set three variables...
- the index symbol, default is SPY
- the period for averaging, default is 60
- the max volume percent, default is 500
Good trading!
Brian Hershey
نص برمجي مفتوح المصدر
بروح TradingView الحقيقية، قام مبتكر هذا النص البرمجي بجعله مفتوح المصدر، بحيث يمكن للمتداولين مراجعة وظائفه والتحقق منها. شكرا للمؤلف! بينما يمكنك استخدامه مجانًا، تذكر أن إعادة نشر الكود يخضع لقواعد الموقع الخاصة بنا.
إخلاء المسؤولية
لا يُقصد بالمعلومات والمنشورات أن تكون، أو تشكل، أي نصيحة مالية أو استثمارية أو تجارية أو أنواع أخرى من النصائح أو التوصيات المقدمة أو المعتمدة من TradingView. اقرأ المزيد في شروط الاستخدام.