PROTECTED SOURCE SCRIPT
High/Low Percentage Difference
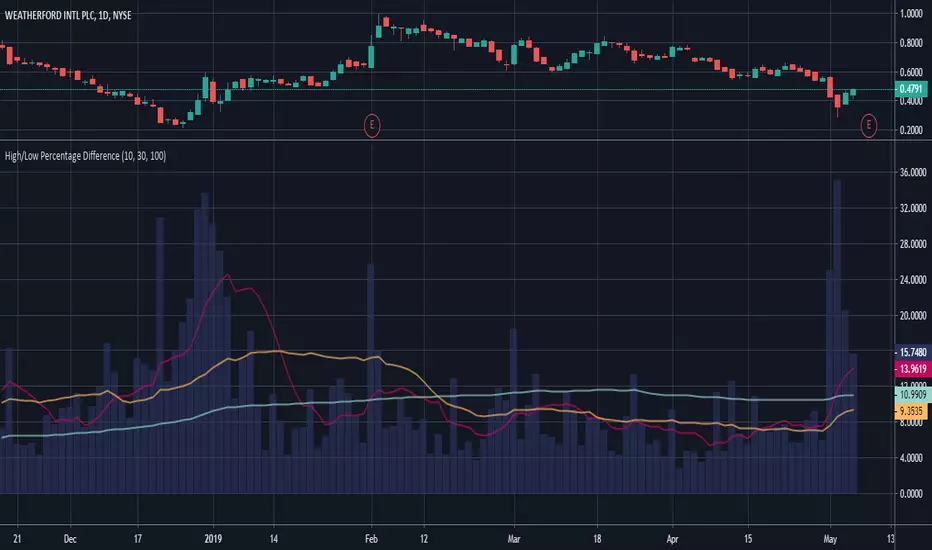
This chart shows simple moving averages of the differences in the high and low prices across the time frame you choose.
I use this when researching to see if the investment vehicle meets my criteria for volatility within the time-frame I want to invest.
The columns show the percentage difference between the current candle's high and low.
The lines show the SMA of the past 10(red), 30(orange), and 100(blue) candles, but you can edit these to be whatever you'd like.
نص برمجي محمي
تم نشر هذا النص البرمجي كمصدر مغلق. ومع ذلك، يمكنك استخدامه بحرية ودون أي قيود - تعرف على المزيد هنا.
إخلاء المسؤولية
لا يُقصد بالمعلومات والمنشورات أن تكون، أو تشكل، أي نصيحة مالية أو استثمارية أو تجارية أو أنواع أخرى من النصائح أو التوصيات المقدمة أو المعتمدة من TradingView. اقرأ المزيد في شروط الاستخدام.