OPEN-SOURCE SCRIPT
Normalized Average True Range
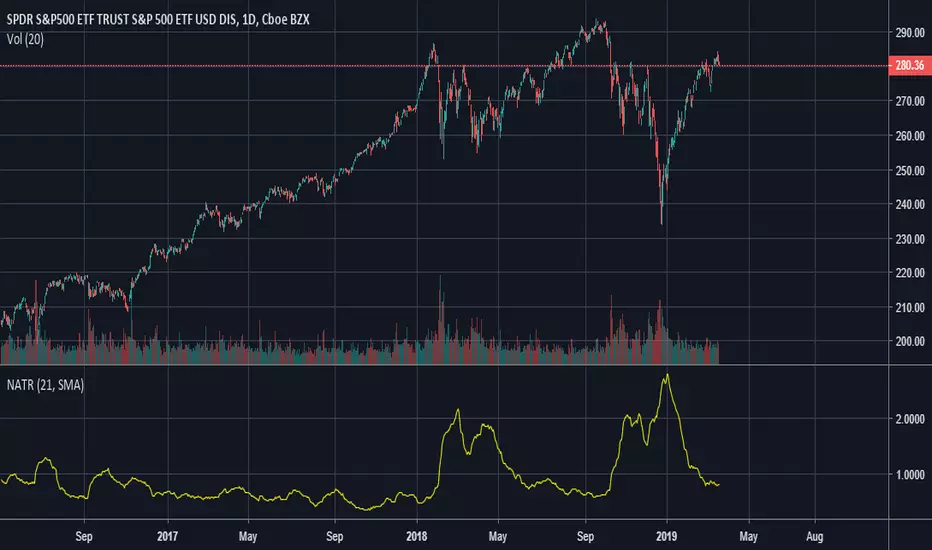
This is a Normalized ATR, which means it displays ATR as a percentage instead of absolute price. For example, a value of 1 indicates a true range of 1% in a given period.
This indicator creates a moving average of the volatility of a product going back X number of periods and is useful for deciding what to trade. For example, if used on a daily chart, one product displays a value of 4 you can reasonably expect it to have larger price swings and movement compared to another product that displays 1.
It does not predict direction, rather the size of moves.
نص برمجي مفتوح المصدر
بروح TradingView الحقيقية، قام مبتكر هذا النص البرمجي بجعله مفتوح المصدر، بحيث يمكن للمتداولين مراجعة وظائفه والتحقق منها. شكرا للمؤلف! بينما يمكنك استخدامه مجانًا، تذكر أن إعادة نشر الكود يخضع لقواعد الموقع الخاصة بنا.
إخلاء المسؤولية
لا يُقصد بالمعلومات والمنشورات أن تكون، أو تشكل، أي نصيحة مالية أو استثمارية أو تجارية أو أنواع أخرى من النصائح أو التوصيات المقدمة أو المعتمدة من TradingView. اقرأ المزيد في شروط الاستخدام.