OPEN-SOURCE SCRIPT
HPotter Last Price

If you, like me, like to watch the market in real time for a long time, then this script will be useful to you. Stay tuned.
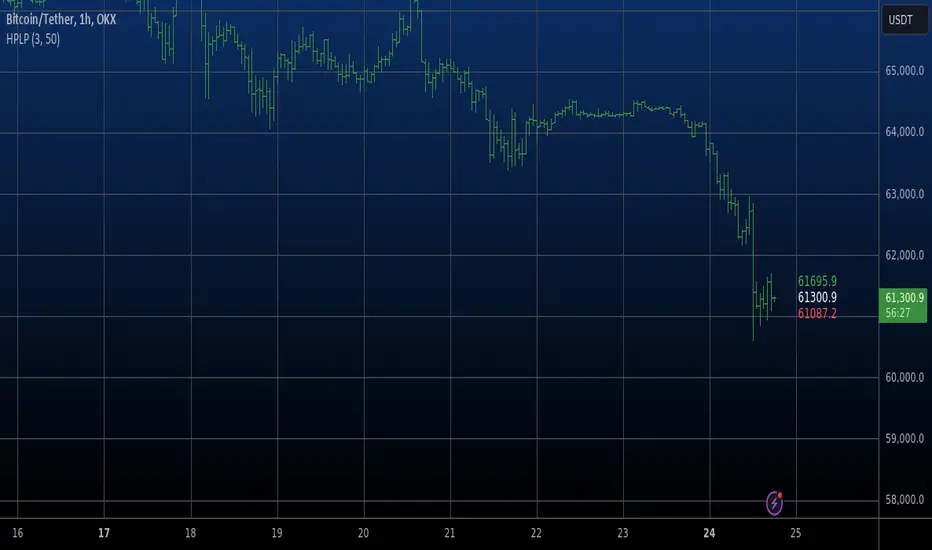
A script that helps you navigate the current price and the latest highs and lows
IMPORTANT: For the script to work correctly, you must enable "On every tick" in Preoperties.
Throw it on any chart.
On the right appears:
white price - last transaction price
green price - current high that has not been reached (looks at bars in history)
red price - current low that has not been reached (looks at bars in history)
yellow price - new high or low installed
نص برمجي مفتوح المصدر
بروح TradingView الحقيقية، قام مبتكر هذا النص البرمجي بجعله مفتوح المصدر، بحيث يمكن للمتداولين مراجعة وظائفه والتحقق منها. شكرا للمؤلف! بينما يمكنك استخدامه مجانًا، تذكر أن إعادة نشر الكود يخضع لقواعد الموقع الخاصة بنا.
إخلاء المسؤولية
لا يُقصد بالمعلومات والمنشورات أن تكون، أو تشكل، أي نصيحة مالية أو استثمارية أو تجارية أو أنواع أخرى من النصائح أو التوصيات المقدمة أو المعتمدة من TradingView. اقرأ المزيد في شروط الاستخدام.