OPEN-SOURCE SCRIPT
تم تحديثه 63-Day Sector Relative Strength vs NIFTY
This script calculates and displays the 63-day returns of major NSE sectoral indices and their relative strength versus the NIFTY 50.
It,
Covered Indices: CNXIT, CNXAUTO, CNXFMCG, CNXPHARMA, CNXENERGY, CNXMETAL, CNXPSUBANK, CNXINFRA, CNXREALTY, CNXFINANCE, CNXMEDIA, BANKNIFTY, CNXCONSUMPTION, CNXCOMMODITIES
How to use this: Quickly identify which sectors are outperforming or underperforming relative to the NIFTY over the past 63 trading sessions (approx. 3 months).
It,
- [computes 63-day price returns for each sector index]
[calculates the relative performance of each sector against the Nifty 50]
[displays results in a table at the top right corner of the chart]
[highlights positive vs negative relative strength for quick comparision]
Covered Indices: CNXIT, CNXAUTO, CNXFMCG, CNXPHARMA, CNXENERGY, CNXMETAL, CNXPSUBANK, CNXINFRA, CNXREALTY, CNXFINANCE, CNXMEDIA, BANKNIFTY, CNXCONSUMPTION, CNXCOMMODITIES
How to use this: Quickly identify which sectors are outperforming or underperforming relative to the NIFTY over the past 63 trading sessions (approx. 3 months).
ملاحظات الأخبار
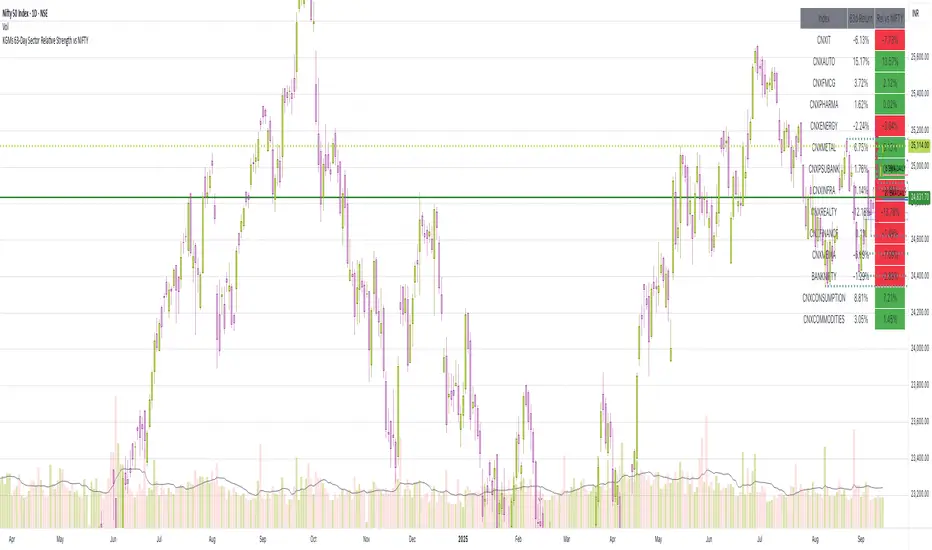
This script calculates and displays the 63-day returns of major NSE sectoral indices and their relative strength versus the NIFTY 50.It,
- Computes 63-day price returns for each sector index.
- Calculates the relative performance of each sector against the NIFTY 50.
- Displays results in a neat table at the top-right corner of the chart.
- Highlights positive vs negative relative strength for quick comparison.
Covered Indices: CNXIT, CNXAUTO, CNXFMCG, CNXPHARMA, CNXENERGY, CNXMETAL, CNXPSUBANK, CNXINFRA, CNXREALTY, CNXFINANCE, CNXMEDIA, BANKNIFTY, CNXCONSUMPTION, CNXCOMMODITIES
Useful to quickly identify which sectors are outperforming or underperforming relative to the broader market (i.e. NIFTY) over the past 63 trading sessions (approx. 3 months). Useful for sector rotation analysis, relative momentum analysis and macro market views
نص برمجي مفتوح المصدر
بروح TradingView الحقيقية، قام مبتكر هذا النص البرمجي بجعله مفتوح المصدر، بحيث يمكن للمتداولين مراجعة وظائفه والتحقق منها. شكرا للمؤلف! بينما يمكنك استخدامه مجانًا، تذكر أن إعادة نشر الكود يخضع لقواعد الموقع الخاصة بنا.
إخلاء المسؤولية
لا يُقصد بالمعلومات والمنشورات أن تكون، أو تشكل، أي نصيحة مالية أو استثمارية أو تجارية أو أنواع أخرى من النصائح أو التوصيات المقدمة أو المعتمدة من TradingView. اقرأ المزيد في شروط الاستخدام.