OPEN-SOURCE SCRIPT
Tommy Oscillator v1.0 Light
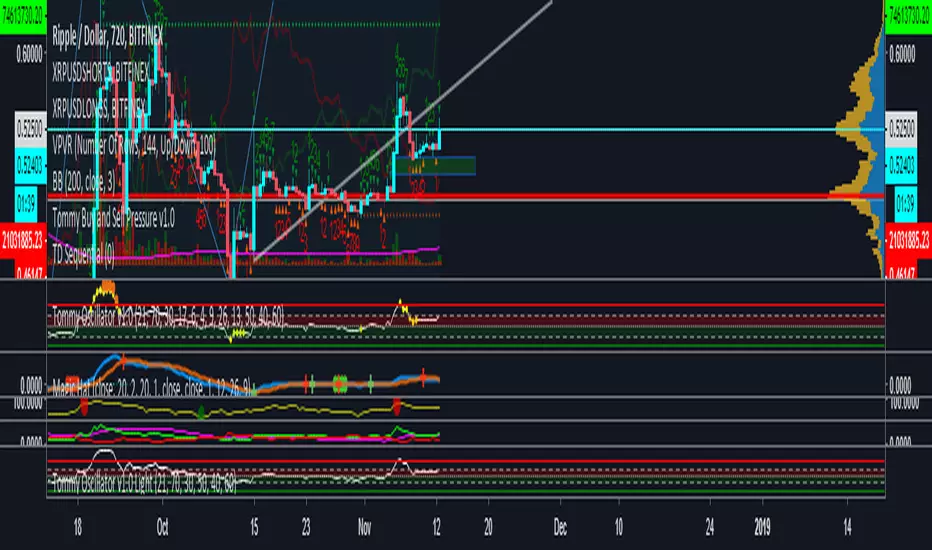
RSI rules: If we break above 70 RSI, 40-50 RSI acts as support,
If we break below 30 RSI, 50-60 RSI acts as resistance
I color coded the support/resistance areas to make visuals easier. This is part of my private indicator, but I removed the buy/sell part (which is the private part). I think this will help a lot with your guy's trading.
If we break below 30 RSI, 50-60 RSI acts as resistance
I color coded the support/resistance areas to make visuals easier. This is part of my private indicator, but I removed the buy/sell part (which is the private part). I think this will help a lot with your guy's trading.
نص برمجي مفتوح المصدر
بروح TradingView الحقيقية، قام مبتكر هذا النص البرمجي بجعله مفتوح المصدر، بحيث يمكن للمتداولين مراجعة وظائفه والتحقق منها. شكرا للمؤلف! بينما يمكنك استخدامه مجانًا، تذكر أن إعادة نشر الكود يخضع لقواعد الموقع الخاصة بنا.
إخلاء المسؤولية
لا يُقصد بالمعلومات والمنشورات أن تكون، أو تشكل، أي نصيحة مالية أو استثمارية أو تجارية أو أنواع أخرى من النصائح أو التوصيات المقدمة أو المعتمدة من TradingView. اقرأ المزيد في شروط الاستخدام.