OPEN-SOURCE SCRIPT
Mark Earnings Day

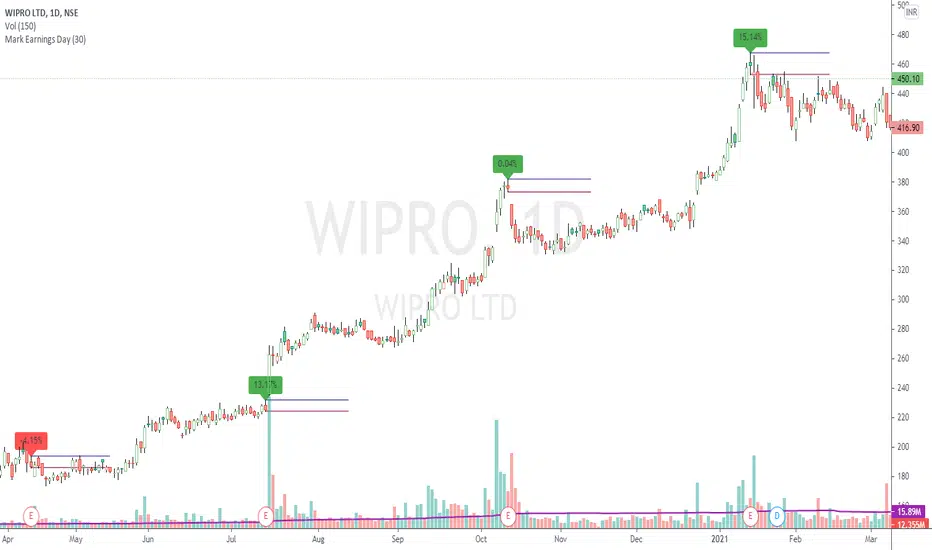
The idea for today is to plot high / low prices on the Earnings day. (use only on Daily timeframe)
And as we all know, most of the times, price is unidirectional after the earnings are declared.
A target of 1:2 or even 1:5 can be easily achieved in these cases, within few days.
Green label indicates, reported earnings are higher than estimated. Red indicates the other way.
But 1, this does not necessarily indicate the trend direction.
But 2, a breakout / breakdown of this day's candle mostly does. The other serving as a Stop Loss.
Optionally, the scripts can also plot splits and dividends on the charts.
The difference between this indicator and readily available default markings on the chart is,
these figures are directly available on the chart itself, that saves multiple clicks.
نص برمجي مفتوح المصدر
بروح TradingView الحقيقية، قام مبتكر هذا النص البرمجي بجعله مفتوح المصدر، بحيث يمكن للمتداولين مراجعة وظائفه والتحقق منها. شكرا للمؤلف! بينما يمكنك استخدامه مجانًا، تذكر أن إعادة نشر الكود يخضع لقواعد الموقع الخاصة بنا.
إخلاء المسؤولية
لا يُقصد بالمعلومات والمنشورات أن تكون، أو تشكل، أي نصيحة مالية أو استثمارية أو تجارية أو أنواع أخرى من النصائح أو التوصيات المقدمة أو المعتمدة من TradingView. اقرأ المزيد في شروط الاستخدام.