OPEN-SOURCE SCRIPT
VCP-Minervini v2
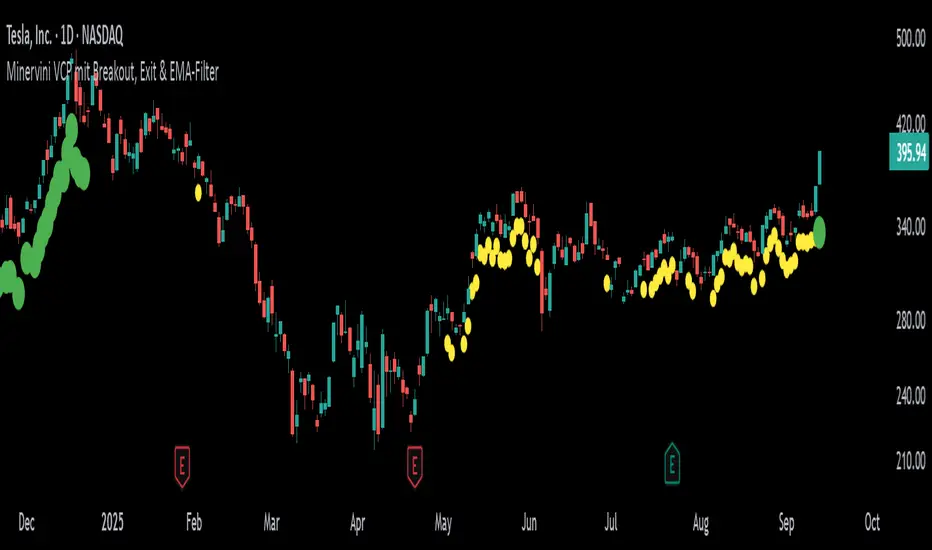
This indicator is based on the famous Volatility Contraction Pattern (VCP) developed by Mark Minervini. It is designed to detect breakout setups in stocks and indices and provides a complete framework for identifying and managing them.
VCP Detection: Uses ATR to measure contracting volatility and highlights potential setups with yellow markers.
Pivot Level: Once a VCP is detected, the script automatically fixes a pivot resistance level and plots it as a red line.
Breakout Signal: When price closes above the pivot and remains above the EMA, a green marker confirms that a breakout is active.
Exit Logic: If momentum fades (volume drops below average and True Range contracts), the green marker disappears, signaling it may be time to secure profits or adjust stops.
EMA Filter: Ensures that setups are only valid in the direction of the prevailing trend by requiring price to trade above the selected EMA.
How to use it
This tool is best suited for swing traders and position traders looking for clean breakout opportunities. It is not a simple mashup of indicators but an original combination specifically built for VCP setups.
Use primarily on daily or weekly charts of liquid stocks.
Build a watchlist from yellow markers (potential setups).
Watch for price closing above the pivot line to confirm the breakout.
Manage trades while the green marker is active, and take caution when it disappears.
Adjust the parameters to fine-tune detection sensitivity for your market or trading style.
نص برمجي مفتوح المصدر
بروح TradingView الحقيقية، قام مبتكر هذا النص البرمجي بجعله مفتوح المصدر، بحيث يمكن للمتداولين مراجعة وظائفه والتحقق منها. شكرا للمؤلف! بينما يمكنك استخدامه مجانًا، تذكر أن إعادة نشر الكود يخضع لقواعد الموقع الخاصة بنا.
إخلاء المسؤولية
لا يُقصد بالمعلومات والمنشورات أن تكون، أو تشكل، أي نصيحة مالية أو استثمارية أو تجارية أو أنواع أخرى من النصائح أو التوصيات المقدمة أو المعتمدة من TradingView. اقرأ المزيد في شروط الاستخدام.