OPEN-SOURCE SCRIPT
تم تحديثه CoffeeShopCrypto 3pl MA

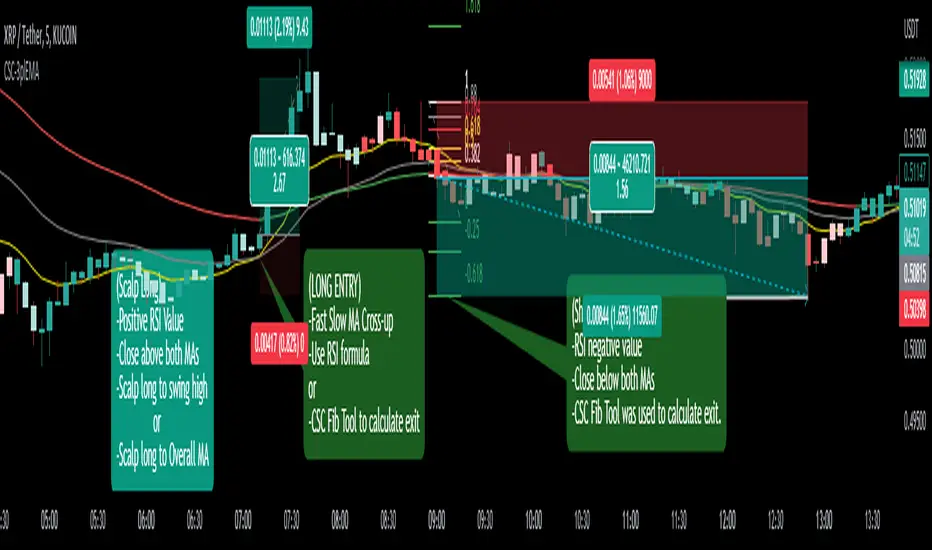
The CoffeeShopCrypto 3pl MA indicator is a technical analysis tool that uses three different moving averages to identify trends in the price of an asset. The three moving averages have lengths of 12, 26, and 50. If these numbers sound familiar its because they are based off the standard of the MACD indicator, and can be either simple moving averages (SMA) or exponential moving averages (EMA), depending on user preference.
The following is plotted on the chart
The fast EMA/SMA (based on the 12-period length) in yellow.
The mid EMA/SMA (based on the 26-period length) in gray.
The slow EMA/SMA (based on the 50-period length) in either green or red, depending on whether the current close price is above or below the Overall Trend MA.
In addition to the moving averages, the indicator also calculates the MACD (Moving Average Convergence Divergence), and uses it to color the bars based on the momentum of the asset.
The MACD is calculated using two user-defined lengths (fast and slow), as well as a user-defined smoothing length for the signal line. The oscillator and signal line can be either SMA or EMA, and the colors of the MACD bars are based on whether the histogram is growing or falling, and whether it is above or below the zero line.
Overall, this indicator provides traders with a comprehensive tool for understanding the trend of an asset, as well as the momentum behind that trend. The moving averages provide a clear visual representation of the trend, while the MACD bars give insight into the strength of that trend and potential shifts in momentum.
---------------LONG ENTRY----------------
MA1 above MA2 and Overall trend = Green
IF RSI is above its midline you are confirmed for a long entry
-----------Short Entry--------------
MA1 below MA2 and Overall trend = Red
IF RSI is below its midline you are confirmed for a short entry
ملاحظات الأخبار
1. Removed unneeded inputs for MACD settings.2. Removed unneeded color settings for MACD line and Signal line as they will not be plotted.
3. Made the code lighter for your charts.
~~~~~~You're Welcome~~~~~
ملاحظات الأخبار
realized it would be great to have two overall MAs on your chart so a secondary overall trend EMA was added.ملاحظات الأخبار
Correction to the TITLE of the Super Slow EMA. Sorry guys. I had a Typoملاحظات الأخبار
- Added a 3rd moving average for better judgement of price action
ملاحظات الأخبار
Adjusted Moving Average Automatic Colors:All moving averages will only color bullish bearish according to their actual movement to give you a better visualization of the slow, mid, and fast trend. When all MAs are the same color, all trends are moving in the same direction.
As an example:
If youre overall trend (Slow MA) is bullish color while either of the other two Moving Averages are opposing colors, are have lost either the fast or the mid term trend.
نص برمجي مفتوح المصدر
بروح TradingView الحقيقية، قام مبتكر هذا النص البرمجي بجعله مفتوح المصدر، بحيث يمكن للمتداولين مراجعة وظائفه والتحقق منها. شكرا للمؤلف! بينما يمكنك استخدامه مجانًا، تذكر أن إعادة نشر الكود يخضع لقواعد الموقع الخاصة بنا.
Discord = discord.gg/EAncX5TpfB
coffeeshopcrypto3@gmail.com
coffeeshopcrypto3@gmail.com
إخلاء المسؤولية
لا يُقصد بالمعلومات والمنشورات أن تكون، أو تشكل، أي نصيحة مالية أو استثمارية أو تجارية أو أنواع أخرى من النصائح أو التوصيات المقدمة أو المعتمدة من TradingView. اقرأ المزيد في شروط الاستخدام.