OPEN-SOURCE SCRIPT
Coloured Volume Grid 1.0
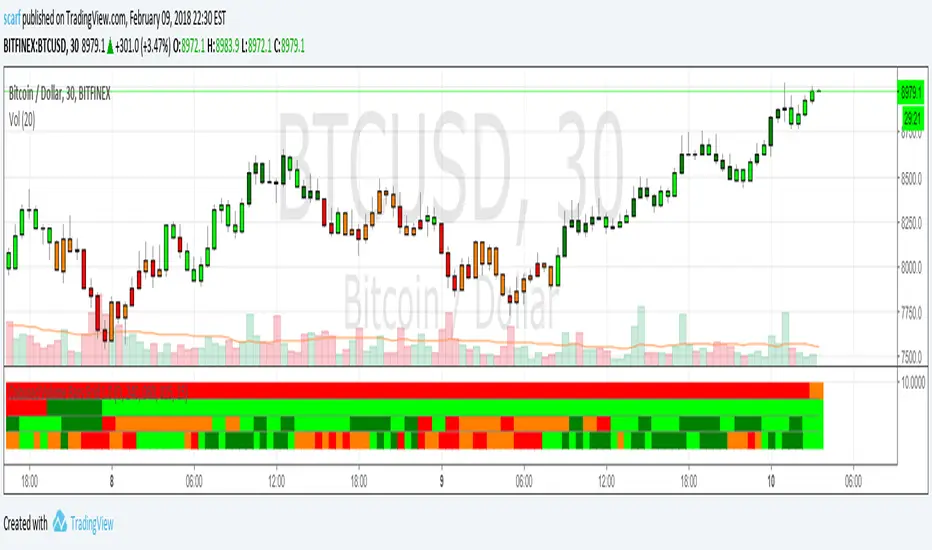
Candles are coloured based on relative price and volume:
- If today’s closing price and volume are greater than (n) bars ago, color today’s volume bar green.
- If today’s closing price is greater than (n) bars ago but volume is not, color today’s volume bar lime.
- Similarly, if today’s closing price and volume is less than (n) bars ago, color today’s volume bar orange.
- If today’s closing price is less than (n) bars ago but volume is not, color today’s volume bar red.
The above logic in itself gives pretty remarkable considering how simple the idea is. I have added a multi-timeframe feature where the same logic is applied to 4 other timeframes. This way you can quickly be aware without having to check. There are four layers and the default settings show (from top to bottom) daily, 4h, 1h and 15m
All timeframes are adjustable in the settings.
نص برمجي مفتوح المصدر
بروح TradingView الحقيقية، قام مبتكر هذا النص البرمجي بجعله مفتوح المصدر، بحيث يمكن للمتداولين مراجعة وظائفه والتحقق منها. شكرا للمؤلف! بينما يمكنك استخدامه مجانًا، تذكر أن إعادة نشر الكود يخضع لقواعد الموقع الخاصة بنا.
إخلاء المسؤولية
لا يُقصد بالمعلومات والمنشورات أن تكون، أو تشكل، أي نصيحة مالية أو استثمارية أو تجارية أو أنواع أخرى من النصائح أو التوصيات المقدمة أو المعتمدة من TradingView. اقرأ المزيد في شروط الاستخدام.