PROTECTED SOURCE SCRIPT
تم تحديثه Earnings, Sales & Volume Dashboard [LevelUp]
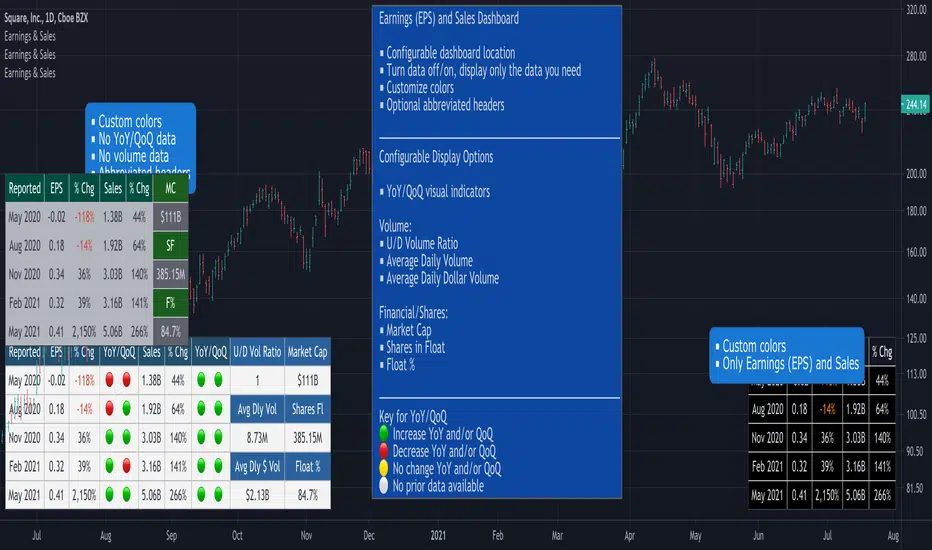
View quarterly earnings per share (EPS) and sales data. Optional visual icons can be shown comparing data on a Year-over-Year (YoY) and/or Quarter-on-Quarter (QoQ) basis.
YoY: quarterly earnings/sales compared to the value in the same quarter of the previous year.
QoQ: quarterly earnings/sales compared to the value of the previous quarter.
Earnings Calculation - Basic EPS vs Diluted
This indicator uses basic EPS data to calculate earnings. For relatively new issues (IPOs, etc), some platforms/tools may use diluted EPS data as a means to account for outstanding stock options, convertible preferred shares, etc. In this scenario, you will notice differences in the earnings information.
Features
■ View quarterly earnings per share (EPS) and sales data.
■ Configure colors for dashboard header and rows.
■ Change location of dashboard.
■ Choose which charts display the dashboard (daily, weekly or monthly).
Pro Tip: Show the dashboard on top of other chart elements:
- Right click on the indicator
- Select 'Visual Order'
- Select 'Bring to Front'
ملاحظات الأخبار
Version 2.0What's New:
■ Support for Depositary Receipts, which trade like stocks and have earnings and sales data.
ملاحظات الأخبار
Version 3.0What's New:
■ EPS and Sales values and percent change
■ Customize color for negative percent change
ملاحظات الأخبار
Version 4.0What's New:
■ Sales values are rounded to two decimal places (hundredths).
ملاحظات الأخبار
Version 5.0What's New:
■ Minor change to the layout of the visual icons.
ملاحظات الأخبار
Version 6.0Additional Volume Data on Daily and/or Weekly Charts:
■ U/D Volume Ratio
■ Average Daily Volume
■ Average Daily Dollar Volume
Additional Financial/Share Data on Daily and/or Weekly Charts:
■ Market Cap
■ Shares in Float
■ Float %
Turn additional data on/off, view only the information that you find helpful.
ملاحظات الأخبار
Version 7.0■ Plot EPS onto the chart as a line, symbol or both.
ملاحظات الأخبار
Version 8.0■ Option to hide EPS, Sales & Volume table.
■ Plot EPS symbols along the bottom of the chart.
ملاحظات الأخبار
Version 9.0■ Minor updates to plotting of EPS when using line and/or symbols.
ملاحظات الأخبار
Version 10.0■ Changes to EPS and Sales calculations when there is limited historical data available.
ملاحظات الأخبار
Version 11.0■ Add additional options for text size.
ملاحظات الأخبار
Version 12.0■ Updates to earnings data. Infrequent issue of random missing data has been fixed.
ملاحظات الأخبار
Version 13.0▪ Add support for 'fund' stock type. With this change, stats for REITs are now available.
نص برمجي محمي
تم نشر هذا النص البرمجي كمصدر مغلق. ومع ذلك، يمكنك استخدامه بحرية ودون أي قيود - تعرف على المزيد هنا.
Join traders in over 40 countries and LevelUp!
tradingview.com/spaces/LevelUpTools/
tradingview.com/spaces/LevelUpTools/
إخلاء المسؤولية
لا يُقصد بالمعلومات والمنشورات أن تكون، أو تشكل، أي نصيحة مالية أو استثمارية أو تجارية أو أنواع أخرى من النصائح أو التوصيات المقدمة أو المعتمدة من TradingView. اقرأ المزيد في شروط الاستخدام.