shock detecter [WS]
if you want free version

usually volaility and volume come together,
but if volume is high and volatility is low,
than blue bar increase.
I named it "abnormal volume shock"
so,
blue signal come only if low volatility + high volume.
blue can come when the price is top(or bottom) but this is not a buy(or sell) signal.
(remember, blue is just a strange moment. high volume + low volatility is not a normal situation. you better to focus "why suddenly volume increased" )
briefly,
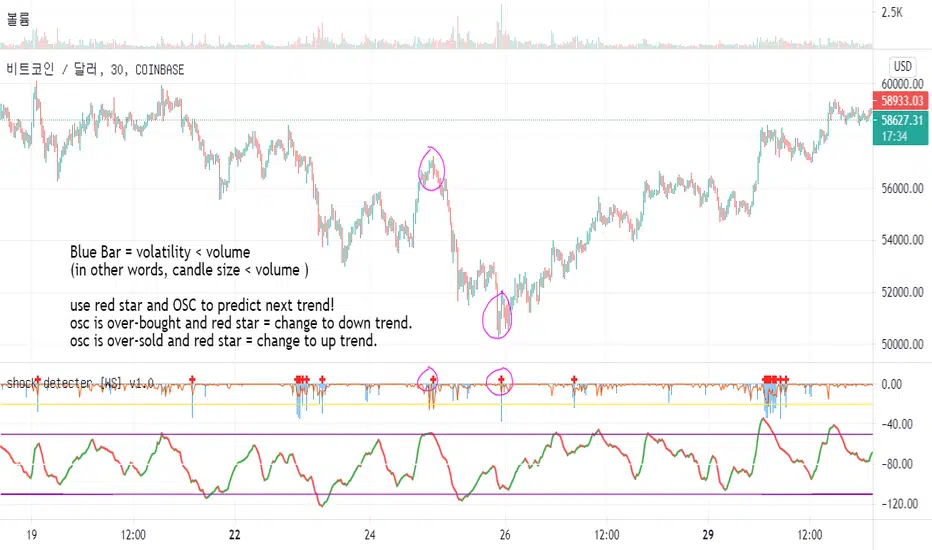
Blue Bar = volatility < volume
(in other words, candle size < volume )
use red star and OSC to predict next trend!
osc is over-bought and red star = change to down trend.
osc is over-sold and red star = change to up trend.
if simple_mode off,
green star = volume shock
orange star = volume shock over threshold (20)
green bar = volatility shock
yellow star = volatility shock over threshold (20)
red bar = volatility reducing (convergence)
white star = end of convergence
نص برمجي للمستخدمين المدعوين فقط
يمكن فقط للمستخدمين الذين تمت الموافقة عليهم من قبل المؤلف الوصول إلى هذا البرنامج النصي. ستحتاج إلى طلب الإذن والحصول عليه لاستخدامه. يتم منح هذا عادةً بعد الدفع. لمزيد من التفاصيل، اتبع تعليمات المؤلف أدناه أو اتصل ب shm837 مباشرة.
لا توصي TradingView بالدفع مقابل برنامج نصي أو استخدامه إلا إذا كنت تثق تمامًا في مؤلفه وتفهم كيفية عمله. يمكنك أيضًا العثور على بدائل مجانية ومفتوحة المصدر في نصوص مجتمعنا.
تعليمات المؤلف
إخلاء المسؤولية
نص برمجي للمستخدمين المدعوين فقط
يمكن فقط للمستخدمين الذين تمت الموافقة عليهم من قبل المؤلف الوصول إلى هذا البرنامج النصي. ستحتاج إلى طلب الإذن والحصول عليه لاستخدامه. يتم منح هذا عادةً بعد الدفع. لمزيد من التفاصيل، اتبع تعليمات المؤلف أدناه أو اتصل ب shm837 مباشرة.
لا توصي TradingView بالدفع مقابل برنامج نصي أو استخدامه إلا إذا كنت تثق تمامًا في مؤلفه وتفهم كيفية عمله. يمكنك أيضًا العثور على بدائل مجانية ومفتوحة المصدر في نصوص مجتمعنا.