PROTECTED SOURCE SCRIPT
Standard Deviation Bands
## 📊 Standard Deviation Bands (SDB) - Multi-Layer Statistical Channel Indicator
### 🎯 Overview
The Standard Deviation Bands indicator is a sophisticated technical analysis tool based on statistical principles that creates dynamic support and resistance channels by calculating price standard deviations. Unlike traditional Bollinger Bands, this indicator employs a **separate high-low calculation approach**, providing more precise boundary positioning for upper and lower bands.
### ✨ Key Features
**🔹 Separate High-Low Algorithm**
- Upper bands calculated using High price moving averages and standard deviations
- Lower bands calculated using Low price moving averages and standard deviations
- Delivers more accurate price boundary identification
**🔹 Multi-Layer Standard Deviation Levels**
- **±1σ**: Basic standard deviation channel for capturing regular price fluctuations
- **±1σ±2σ**: Dual-layer channels for identifying medium-strength support/resistance
- **±1σ±2σ±3σ**: Triple-layer channels providing complete price volatility analysis framework
**🔹 Flexible Moving Average Options**
- SMA (Simple Moving Average)
- EMA (Exponential Moving Average)
- WMA (Weighted Moving Average)
- RMA (Rolling Moving Average)
- VWMA (Volume Weighted Moving Average)
### 🛠️ Parameter Configuration
| Parameter | Default | Description |
|-----------|---------|-------------|
| Length | 30 | Calculation period length |
| Multiplication Factor | 1.8 | Standard deviation multiplier |
| Top Band Input Data | High | Data source for upper bands |
| Bottom Band Input Data | Low | Data source for lower bands |
| Moving Average Type | SMA | Type of moving average |
| Show Levels | ±1σ | Standard deviation levels to display |
| Show Bands | true | Whether to display channel lines |
| Show Moving Averages | true | Whether to display basis moving averages |
### 📈 Trading Applications
**Support & Resistance Identification**
- Monitor selling opportunities when price approaches upper bands
- Look for buying opportunities when price approaches lower bands
- Multi-layer channels provide different strength support/resistance references
**Trend Strength Assessment**
- Channel width reflects market volatility
- Price breakouts beyond outer channels may signal strong trends
- Price oscillation within inner channels indicates consolidation
**Entry Timing Optimization**
- Combine with candlestick patterns at channel boundaries for reversal signals
- Post-breakout pullbacks provide low-risk entry opportunities
- Enhanced effectiveness when used across multiple timeframes
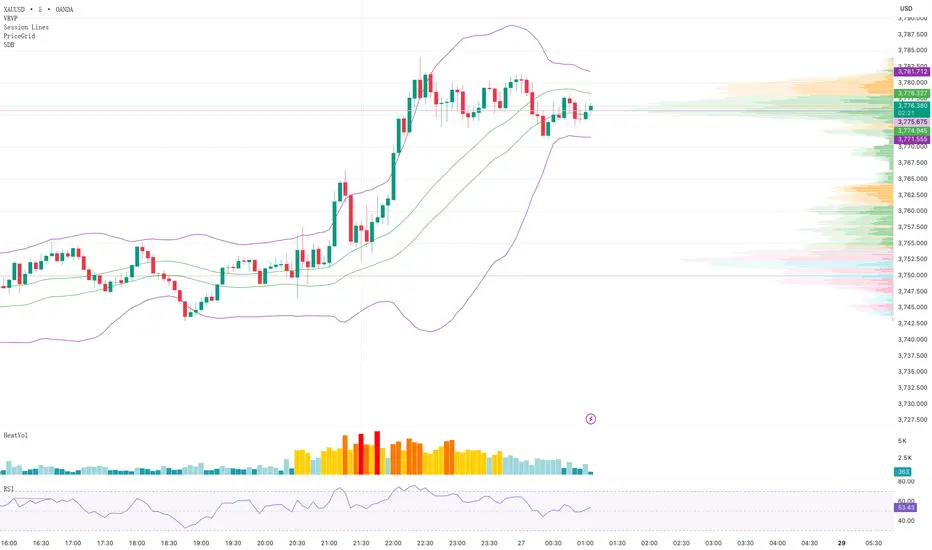
### 🎨 Visual Design
- Purple 1σ channel lines for clear primary support/resistance identification
- Orange 2σ channel lines marking medium-strength boundaries
- Green 3σ channel lines indicating extreme value boundaries
- Customizable colors and line widths to suit different chart styles
### 💡 Usage Recommendations
1. **Period Selection**: Use 15-30 periods for short-term trading, 50-100 for medium-long term
2. **Multiplier Adjustment**: Increase multiplier for high-volatility instruments, decrease for stable ones
3. **Level Selection**: Beginners should start with ±1σ, advance to multi-layer after gaining experience
4. **Combined Usage**: Enhanced effectiveness when combined with volume, RSI, and other indicators
### 🔧 Technical Advantages
- Built on solid statistical mathematical foundation
- Separate high-low calculations provide more precise boundary positioning
- Multi-layer design adapts to different trading styles
- Flexible parameter adjustment suitable for various market conditions
---
**Applicable Markets**: Stocks, Forex, Cryptocurrencies, Futures, and all financial markets
**Applicable Timeframes**: 1-minute to monthly charts
**Skill Level**: Beginner to advanced traders
*Disclaimer: This indicator is for technical analysis reference only and does not constitute investment advice. Trading involves risks; invest cautiously.*
نص برمجي محمي
تم نشر هذا النص البرمجي كمصدر مغلق. ومع ذلك، يمكنك استخدامه بحرية ودون أي قيود - تعرف على المزيد هنا.
إخلاء المسؤولية
لا يُقصد بالمعلومات والمنشورات أن تكون، أو تشكل، أي نصيحة مالية أو استثمارية أو تجارية أو أنواع أخرى من النصائح أو التوصيات المقدمة أو المعتمدة من TradingView. اقرأ المزيد في شروط الاستخدام.