OPEN-SOURCE SCRIPT
PE Range
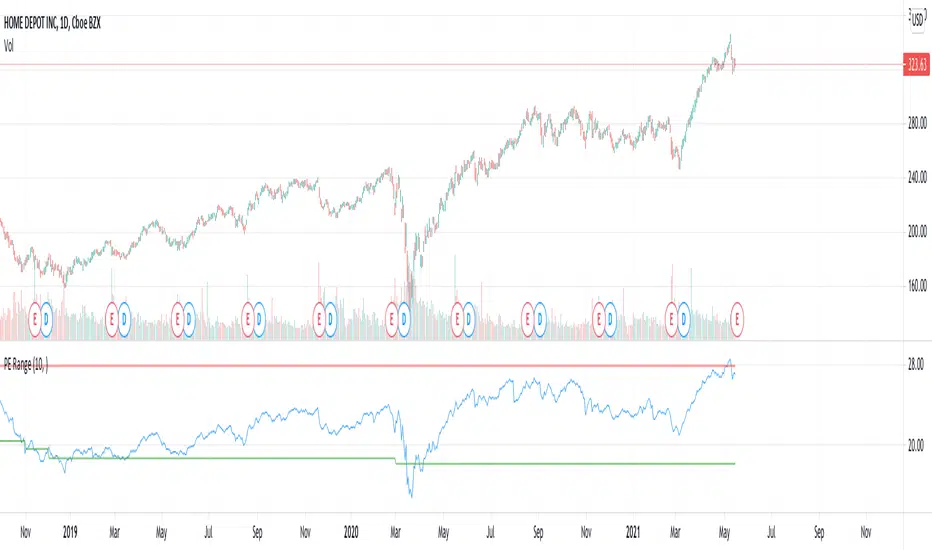
Here is an attempt to mix fundamentals with technicals.
Study plots PE ratio on charts. We also plot historical max and min PE ratio based on loopback years input.
Apparently, tradingview has capability to get historical financials into charts and make use of them in our trading strategies.
tradingview.com/?solution=43000564727
Will be exploring them further.
نص برمجي مفتوح المصدر
بروح TradingView الحقيقية، قام مبتكر هذا النص البرمجي بجعله مفتوح المصدر، بحيث يمكن للمتداولين مراجعة وظائفه والتحقق منها. شكرا للمؤلف! بينما يمكنك استخدامه مجانًا، تذكر أن إعادة نشر الكود يخضع لقواعد الموقع الخاصة بنا.
Trial - trendoscope.io/trial
Subscribe - trendoscope.io/pricing
Blog - docs.trendoscope.io
Subscribe - trendoscope.io/pricing
Blog - docs.trendoscope.io
إخلاء المسؤولية
لا يُقصد بالمعلومات والمنشورات أن تكون، أو تشكل، أي نصيحة مالية أو استثمارية أو تجارية أو أنواع أخرى من النصائح أو التوصيات المقدمة أو المعتمدة من TradingView. اقرأ المزيد في شروط الاستخدام.