PROTECTED SOURCE SCRIPT
تم تحديثه TRADE ORBIT:INVESTMENT INDICATOR
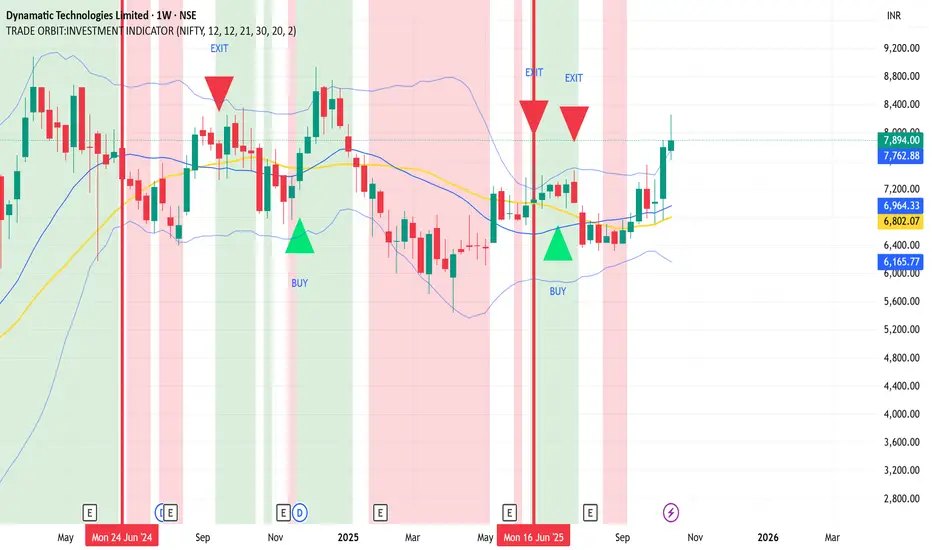
Key Features:
Relative Strength vs NIFTY
Monthly RS(12): Measures how the symbol is performing relative to NIFTY over the past 12 months.
Positive RS indicates the symbol is outperforming the benchmark.
Momentum Filter (Weekly RSI)
Weekly RSI(12) identifies bullish or bearish momentum.
Background turns green when RSI > 50 and monthly RS > 0, signaling a strong bullish environment.
Background turns red when RSI < 50, monthly RS < 0, and weekly RS(21) < 0, signaling weakness.
Weekly RS(21) Buy/Exit Signals
Buy Signal: Triggered when weekly RS(21) crosses above 0 while background is green, confirming momentum breakout.
Exit Signal: Triggered when weekly RS(21) crosses below 0 while background is green, signaling a reversal in momentum.
Trend & Volatility Tools
SMA 30: Displays the short-term trend for price alignment.
Bollinger Bands (20,2): Measures volatility and potential support/resistance zones.
Visuals:
Green/Red semi-transparent backgrounds for bullish/bearish zones.
Buy signals marked with green upward triangles; Exit signals marked with red downward triangles.
SMA30 plotted in yellow; Bollinger Bands plotted in blue.
How to Use:
Entry: Look for green background + weekly RS(21) crossing above zero.
Exit: Close positions when weekly RS(21) crosses below zero.
Use SMA30 and Bollinger Bands to confirm trend and volatility alignment.
This indicator is perfect for traders who want a multi-timeframe strategy combining momentum, relative strength, and trend/volatility confirmation in a single chart overlay
ملاحظات الأخبار
Key Features:Relative Strength vs NIFTY
Monthly RS(12): Measures how the symbol is performing relative to NIFTY over the past 12 months.
Positive RS indicates the symbol is outperforming the benchmark.
Momentum Filter (Weekly RSI)
Weekly RSI(12) identifies bullish or bearish momentum.
Background turns green when RSI > 50 and monthly RS > 0, signaling a strong bullish environment.
Background turns red when RSI < 50, monthly RS < 0, and weekly RS(21) < 0, signaling weakness.
Weekly RS(21) Buy/Exit Signals
Buy Signal: Triggered when weekly RS(21) crosses above 0 while background is green, confirming momentum breakout.
Exit Signal: Triggered when weekly RS(21) crosses below 0 while background is green, signaling a reversal in momentum.
Trend & Volatility Tools
SMA 30: Displays the short-term trend for price alignment.
Bollinger Bands (20,2): Measures volatility and potential support/resistance zones.
Visuals:
Green/Red semi-transparent backgrounds for bullish/bearish zones.
Buy signals marked with green upward triangles; Exit signals marked with red downward triangles.
SMA30 plotted in yellow; Bollinger Bands plotted in blue.
How to Use:
Entry: Look for green background + weekly RS(21) crossing above zero.
Exit: Close positions when weekly RS(21) crosses below zero.
Use SMA30 and Bollinger Bands to confirm trend and volatility alignment.
This indicator is perfect for traders who want a multi-timeframe strategy combining momentum, relative strength, and trend/volatility confirmation in a single chart overlay
نص برمجي محمي
تم نشر هذا النص البرمجي كمصدر مغلق. ومع ذلك، يمكنك استخدامه بحرية ودون أي قيود - تعرف على المزيد هنا.
إخلاء المسؤولية
لا يُقصد بالمعلومات والمنشورات أن تكون، أو تشكل، أي نصيحة مالية أو استثمارية أو تجارية أو أنواع أخرى من النصائح أو التوصيات المقدمة أو المعتمدة من TradingView. اقرأ المزيد في شروط الاستخدام.