PROTECTED SOURCE SCRIPT
Dios51 TrendMatrix
🟢 Dios51 TrendMatrix – User Manual
Purpose:
Identify early trend breakouts with EMA High/Low channels, EMA200 trend filter, and RSI momentum confirmation.
📊 Components Overview
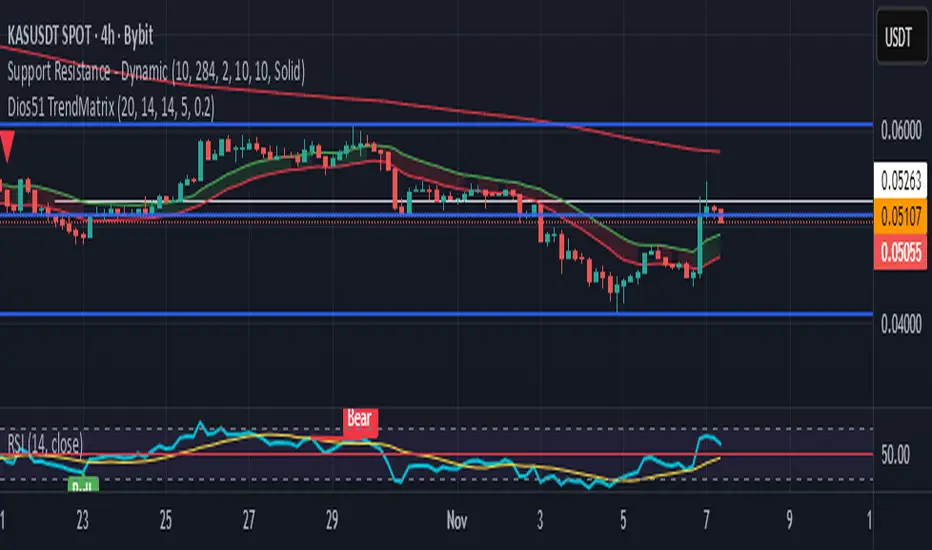
EMA High / EMA Low (Green & Red lines) – Define a dynamic price channel for breakout detection.
EMA200 (Yellow = Bullish, Red = Bearish) – Shows overall trend direction. Trade primarily in the EMA200 trend direction.
RSI + MA – Confirms momentum; crossover above MA signals bullish momentum, below MA signals bearish.
Background Fill – Green = bullish, Red = bearish. Visual aid for trend alignment.
Signal Arrows –
🔼 Green = Long breakout signal
🔽 Red = Short breakout signal
✅ Long Signal (Buy) Criteria
Candle closes above EMA High
RSI crosses above its MA
Candle is bullish (close > open)
Candle meets ATR filter (strong breakout)
EMA200 is Yellow (Bullish)
Cooldown period between signals is satisfied
❌ Short Signal (Sell) Criteria
Candle closes below EMA Low
RSI crosses below its MA
Candle is bearish (close < open)
Candle meets ATR filter (strong breakout)
EMA200 is Red (Bearish)
Cooldown period between signals is satisfied
🎯 Trade Management
Entry:
Next candle after the arrow appears
Confirm EMA200 trend aligns with the signal direction
Stop-loss:
For Long → below EMA Low
For Short → above EMA High
Exit:
Price re-enters EMA channel
Trend weakens (EMA200 changes color)
⚙️ Tips for Best Performance
Ideal on 15m–4h charts
Avoid sideways/consolidation markets
Trade only in direction of EMA200 color for higher probability
Combine with volume or higher timeframe EMA for additional confirmation
📌 Panel Legend (if using on-chart panel)
EMA200: Yellow = Bullish, Red = Bearish
Last Signal: Long / Short / None
RSI Status: Above MA = bullish, Below MA = bearish
Purpose:
Identify early trend breakouts with EMA High/Low channels, EMA200 trend filter, and RSI momentum confirmation.
📊 Components Overview
EMA High / EMA Low (Green & Red lines) – Define a dynamic price channel for breakout detection.
EMA200 (Yellow = Bullish, Red = Bearish) – Shows overall trend direction. Trade primarily in the EMA200 trend direction.
RSI + MA – Confirms momentum; crossover above MA signals bullish momentum, below MA signals bearish.
Background Fill – Green = bullish, Red = bearish. Visual aid for trend alignment.
Signal Arrows –
🔼 Green = Long breakout signal
🔽 Red = Short breakout signal
✅ Long Signal (Buy) Criteria
Candle closes above EMA High
RSI crosses above its MA
Candle is bullish (close > open)
Candle meets ATR filter (strong breakout)
EMA200 is Yellow (Bullish)
Cooldown period between signals is satisfied
❌ Short Signal (Sell) Criteria
Candle closes below EMA Low
RSI crosses below its MA
Candle is bearish (close < open)
Candle meets ATR filter (strong breakout)
EMA200 is Red (Bearish)
Cooldown period between signals is satisfied
🎯 Trade Management
Entry:
Next candle after the arrow appears
Confirm EMA200 trend aligns with the signal direction
Stop-loss:
For Long → below EMA Low
For Short → above EMA High
Exit:
Price re-enters EMA channel
Trend weakens (EMA200 changes color)
⚙️ Tips for Best Performance
Ideal on 15m–4h charts
Avoid sideways/consolidation markets
Trade only in direction of EMA200 color for higher probability
Combine with volume or higher timeframe EMA for additional confirmation
📌 Panel Legend (if using on-chart panel)
EMA200: Yellow = Bullish, Red = Bearish
Last Signal: Long / Short / None
RSI Status: Above MA = bullish, Below MA = bearish
نص برمجي محمي
تم نشر هذا النص البرمجي كمصدر مغلق. ومع ذلك، يمكنك استخدامه بحرية ودون أي قيود - تعرف على المزيد هنا.
إخلاء المسؤولية
لا يُقصد بالمعلومات والمنشورات أن تكون، أو تشكل، أي نصيحة مالية أو استثمارية أو تجارية أو أنواع أخرى من النصائح أو التوصيات المقدمة أو المعتمدة من TradingView. اقرأ المزيد في شروط الاستخدام.