PROTECTED SOURCE SCRIPT
Litt Heat Map
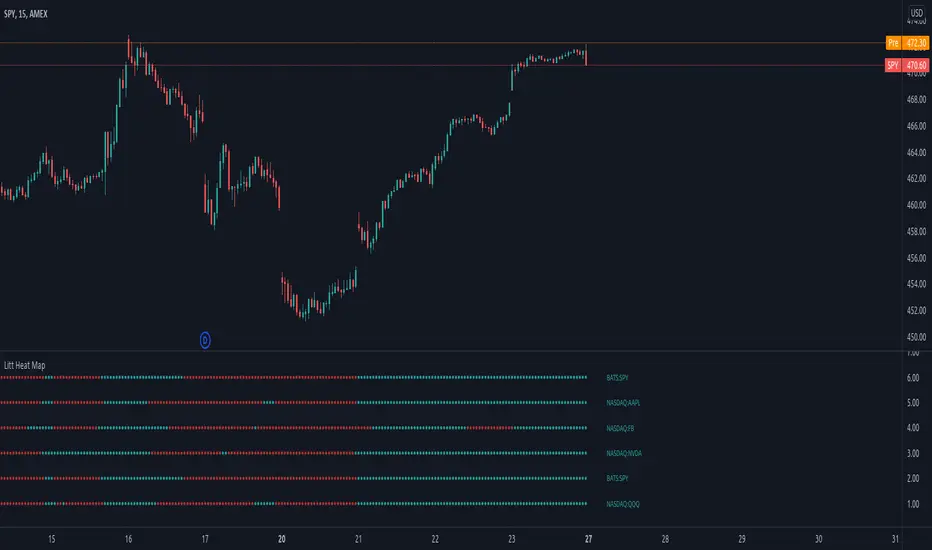
The Litt Heap Map uses the MA Line (Moving Average Line) from Litt Pro Indicators. The Heat Map tells the trader the trend direction based on MA 1 and MA 2.
If the value of MA 1 is greater than the value of MA 2 then the MA Line is colored Bull.
If the value of MA 1 is less than the value of MA 2 then the MA Line is colored Bear.
The Litt Heat Map allows you to see the MA Line for multiple symbols on 1 chart! You can use the Heat Map as a scanner to see when trend has changed, or as a trend confirmation tool when multiple symbols are aligning.
نص برمجي محمي
تم نشر هذا النص البرمجي كمصدر مغلق. ومع ذلك، يمكنك استخدامه بحرية ودون أي قيود - تعرف على المزيد هنا.
إخلاء المسؤولية
لا يُقصد بالمعلومات والمنشورات أن تكون، أو تشكل، أي نصيحة مالية أو استثمارية أو تجارية أو أنواع أخرى من النصائح أو التوصيات المقدمة أو المعتمدة من TradingView. اقرأ المزيد في شروط الاستخدام.