OPEN-SOURCE SCRIPT
[PlayBit]Correlation-Co _OI
[PlayBit] Correlation-Co _OI
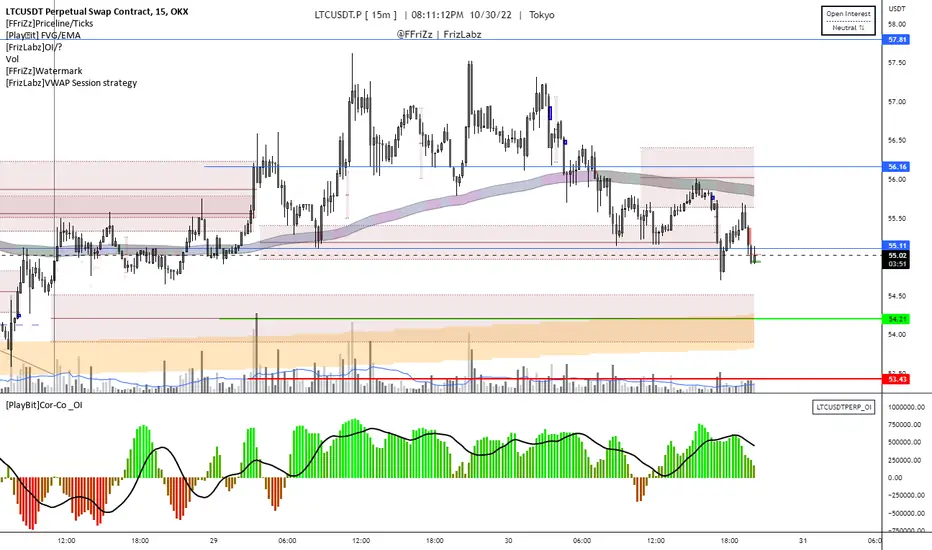
This Indicator uses a Correlation Coefficient to compare a Crypto Currency to the Binance Open Interest feed if the data is provided
A move in the same direction is indicated with a positive value (the indicator will move up)
A move in the opposite direction the indicator will indicate with a negative value (the indicator will move down)
If both are moving in the same direction and are converging or diverging this will be shown by larger values for divergence and smaller for convergence but will be a positive value
Negative values are shown when price and _OI are moving opposite each other
You can toggle the auto Open Interest option in the settings to use something other than Open Interest if you would like
I still need to add a visual showing when longs are unwinding or opening and when shorts are covering or opening
This is a concept that I made for JOHNNY a while back and I'm republishing public from private
This can be useful when comparing a Asset with its Open Interest
The main bit of code was taken from:
https://www.tradingview.com/script/y5n6dlJm-Spearman-Rank-Correlation-Coefficient/
by mortdiggiddy
Let me know if you have any Ideas or suggestions or if I overlooked something
Hope you enjoy,
FFriZz | frizlabz
نص برمجي مفتوح المصدر
بروح TradingView الحقيقية، قام مبتكر هذا النص البرمجي بجعله مفتوح المصدر، بحيث يمكن للمتداولين مراجعة وظائفه والتحقق منها. شكرا للمؤلف! بينما يمكنك استخدامه مجانًا، تذكر أن إعادة نشر الكود يخضع لقواعد الموقع الخاصة بنا.
إخلاء المسؤولية
لا يُقصد بالمعلومات والمنشورات أن تكون، أو تشكل، أي نصيحة مالية أو استثمارية أو تجارية أو أنواع أخرى من النصائح أو التوصيات المقدمة أو المعتمدة من TradingView. اقرأ المزيد في شروط الاستخدام.