OPEN-SOURCE SCRIPT
تم تحديثه Seasonal tendency: week-on-week % change and 10yr Averages

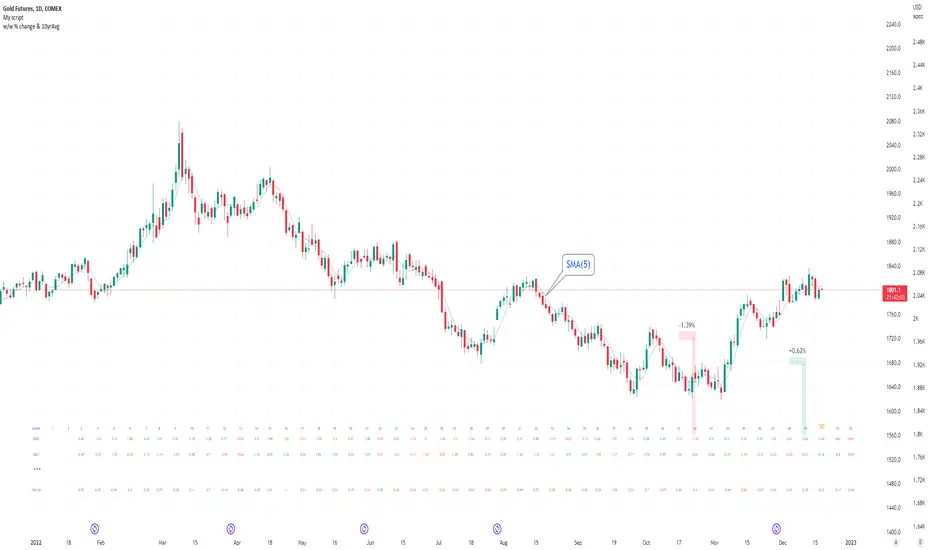
-shows week-on-week % change, and 10yr averages of these % changes
-scan across the 10yr averages to get a good idea of the seasonality of an asset
-best used on commodities with strong seasonal tendencies (Gold, Wheat, Coffee, Lean hogs etc)
-works only on daily timeframe
-by default it will compare SMA(length) in the following way, BTC: Sunday cf previous Sunday | ES/Gold: Monday cf previous Monday
-for most assets, 5 daily bars in a week (SMA(5)) => that's the default. For BTC can change this to 7.
~~inputs:
-change input year to show any previous decade of asset's history; the table will display over that year on the chart
-choose expression for Average of % change week on week: SMA, ohlc4, vwma, vwap (default SMA)
-choose number of daily bars in a week (i.e. SMA length)
-change label sizes/colors
~~notes:
-When applied to current year: will print the 10yr average for previous weeks in the year; 9yr average for future weeks in the year
-drawings and SMA plot on the above chart are just to show visually how the week's average is calculated, and how this lines up with the label
-current week of year will highlight in large font orange by default
-the first 2 weeks of the year are omitted because of a bug i can't figure out, which throws out bad numbers.
-cannot print all the values for each of previous 10yrs; 'code too long' error. Could likely do this via using matrices but would require a rewrite
17th Dec 2022
twingall
ملاحظات الأخبار
~added invisible spacers so this always automatically plots neatly at the bottom of the chartملاحظات الأخبار
~cleaned up commentsنص برمجي مفتوح المصدر
بروح TradingView الحقيقية، قام مبتكر هذا النص البرمجي بجعله مفتوح المصدر، بحيث يمكن للمتداولين مراجعة وظائفه والتحقق منها. شكرا للمؤلف! بينما يمكنك استخدامه مجانًا، تذكر أن إعادة نشر الكود يخضع لقواعد الموقع الخاصة بنا.
You can buy me a coffee here...
PayPal.Me/twingall
BTC: 3JrhUwNRnKyqhaa1n1AXKeAubNeEFoch6S
ETH erc20: 0x4b0400B1c18503529ab69611e82a934DDe4Ab038
ETH bep20: 0x1F0f03F184079bb1085F8C9dF3a8191C9f5869B3
PayPal.Me/twingall
BTC: 3JrhUwNRnKyqhaa1n1AXKeAubNeEFoch6S
ETH erc20: 0x4b0400B1c18503529ab69611e82a934DDe4Ab038
ETH bep20: 0x1F0f03F184079bb1085F8C9dF3a8191C9f5869B3
إخلاء المسؤولية
لا يُقصد بالمعلومات والمنشورات أن تكون، أو تشكل، أي نصيحة مالية أو استثمارية أو تجارية أو أنواع أخرى من النصائح أو التوصيات المقدمة أو المعتمدة من TradingView. اقرأ المزيد في شروط الاستخدام.
نص برمجي مفتوح المصدر
بروح TradingView الحقيقية، قام مبتكر هذا النص البرمجي بجعله مفتوح المصدر، بحيث يمكن للمتداولين مراجعة وظائفه والتحقق منها. شكرا للمؤلف! بينما يمكنك استخدامه مجانًا، تذكر أن إعادة نشر الكود يخضع لقواعد الموقع الخاصة بنا.
You can buy me a coffee here...
PayPal.Me/twingall
BTC: 3JrhUwNRnKyqhaa1n1AXKeAubNeEFoch6S
ETH erc20: 0x4b0400B1c18503529ab69611e82a934DDe4Ab038
ETH bep20: 0x1F0f03F184079bb1085F8C9dF3a8191C9f5869B3
PayPal.Me/twingall
BTC: 3JrhUwNRnKyqhaa1n1AXKeAubNeEFoch6S
ETH erc20: 0x4b0400B1c18503529ab69611e82a934DDe4Ab038
ETH bep20: 0x1F0f03F184079bb1085F8C9dF3a8191C9f5869B3
إخلاء المسؤولية
لا يُقصد بالمعلومات والمنشورات أن تكون، أو تشكل، أي نصيحة مالية أو استثمارية أو تجارية أو أنواع أخرى من النصائح أو التوصيات المقدمة أو المعتمدة من TradingView. اقرأ المزيد في شروط الاستخدام.