Kaufman Trend Navigator [QuantAlgo]
The Kaufman Trend Navigator is an adaptive trend following system that combines efficiency-weighted price smoothing with volatility-adjusted bands to identify and track directional market movements. The indicator dynamically adjusts its sensitivity based on market conditions, becoming more responsive during trending periods and more conservative during consolidation. This dual-layer approach provides traders and investors with a systematic framework for trend identification, entry timing, and risk management across multiple timeframes and asset classes.
🟢 How It Works
The indicator employs an efficiency ratio mechanism that measures the directional movement of price relative to total price volatility over a defined lookback period. This ratio determines the adaptive response rate, allowing the system to distinguish between genuine directional moves and random market noise. When price exhibits strong directional characteristics, the internal smoothing accelerates to track the trend more closely. Conversely, during periods of low efficiency or choppy price action, the smoothing becomes more conservative to filter out false signals.
Volatility bands are constructed using normalized range measurements, creating dynamic upper and lower boundaries around the adaptive trend calculation. These bands expand and contract based on recent market volatility, providing context-dependent thresholds for trend validation. The trend line itself updates through a band-following logic where it tracks the relevant boundary based on the current directional bias, creating a stepping mechanism that maintains trend persistence while allowing for validated reversals.
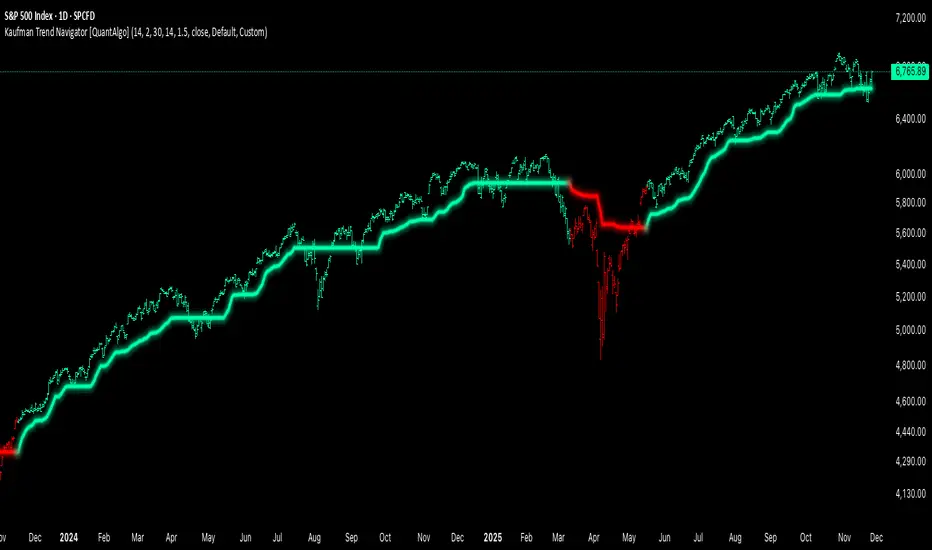
The visual representation uses a gradient-weighted display to emphasize the primary trend line while maintaining clarity on price charts. Trend direction changes trigger when the internal logic confirms a boundary crossover, generating signals for potential position entries or exits. The system includes preset configurations calibrated for different trading timeframes, from responsive settings for scalping to smoother parameters suited for swing and position trading.
🟢 How to Use It
▶ Enter Long positions when the trend line transitions to Bullish (Green) coloring, which indicates upward directional bias has been established. Conversely, enter Short positions or exit Longs when the trend line shifts to Bearish (Red), which signals confirmed downward momentum.
The trend line itself can be used as dynamic support during uptrends and resistance during downtrends, providing logical areas for position management and stop placement. Price remaining above the line during bullish phases or below during bearish phases can also be used as a confirmation of trend strength and continuation probability.
▶ Built-in alert functionality provides real-time notifications for trend changes without requiring continuous chart monitoring. Configure alerts for Bullish Trend Signal to capture upward reversals, Bearish Trend Signal for downward shifts, or the general Trend Change alert to monitor both directions simultaneously. These alerts trigger only on confirmed trend transitions, reducing noise from intrabar fluctuations.
The indicator also includes six color presets (Classic, Aqua, Cosmic, Ember, Neon, Custom) to optimize visual clarity across different chart themes and lighting conditions. Select presets based on your monitor setup and background preference to ensure immediate trend recognition without visual strain. Bar coloring can be enabled to highlight trend direction directly on the price chart, eliminating the need to reference the trend line position during rapid market analysis.
🟢 Pro Tips for Trading and Investing
▶ Match the preset configuration (or your preferred settings) to your trading timeframe: use Fast Response for intraday charts (1-15 minutes), Default for swing trading (hourly to daily), and Smooth Trend for position trading (4-hour to weekly).
▶ Combine trend signals with volume analysis and market structure to filter lower-probability setups. During sideways markets, expect increased signal frequency with reduced reliability; consider waiting for the trend line to establish a clear slope before committing capital.
▶ Use the trend line as a trailing reference rather than a fixed stop level, allowing normal intrabar volatility while protecting against genuine reversals.
▶ For portfolio management, align position sizing with trend strength by observing the angle and consistency of the trend line progression.
نص برمجي للمستخدمين المدعوين فقط
يمكن فقط للمستخدمين الذين تمت الموافقة عليهم من قبل المؤلف الوصول إلى هذا البرنامج النصي. ستحتاج إلى طلب الإذن والحصول عليه لاستخدامه. يتم منح هذا عادةً بعد الدفع. لمزيد من التفاصيل، اتبع تعليمات المؤلف أدناه أو اتصل ب QuantAlgo مباشرة.
لا توصي TradingView بالدفع مقابل برنامج نصي أو استخدامه إلا إذا كنت تثق تمامًا في مؤلفه وتفهم كيفية عمله. يمكنك أيضًا العثور على بدائل مجانية ومفتوحة المصدر في نصوص مجتمعنا.
تعليمات المؤلف
📩 DM if you need any custom-built indicators or strategies.
إخلاء المسؤولية
نص برمجي للمستخدمين المدعوين فقط
يمكن فقط للمستخدمين الذين تمت الموافقة عليهم من قبل المؤلف الوصول إلى هذا البرنامج النصي. ستحتاج إلى طلب الإذن والحصول عليه لاستخدامه. يتم منح هذا عادةً بعد الدفع. لمزيد من التفاصيل، اتبع تعليمات المؤلف أدناه أو اتصل ب QuantAlgo مباشرة.
لا توصي TradingView بالدفع مقابل برنامج نصي أو استخدامه إلا إذا كنت تثق تمامًا في مؤلفه وتفهم كيفية عمله. يمكنك أيضًا العثور على بدائل مجانية ومفتوحة المصدر في نصوص مجتمعنا.
تعليمات المؤلف
📩 DM if you need any custom-built indicators or strategies.