INVITE-ONLY SCRIPT
Demand Supply Indicator With Alerts
تم تحديثه
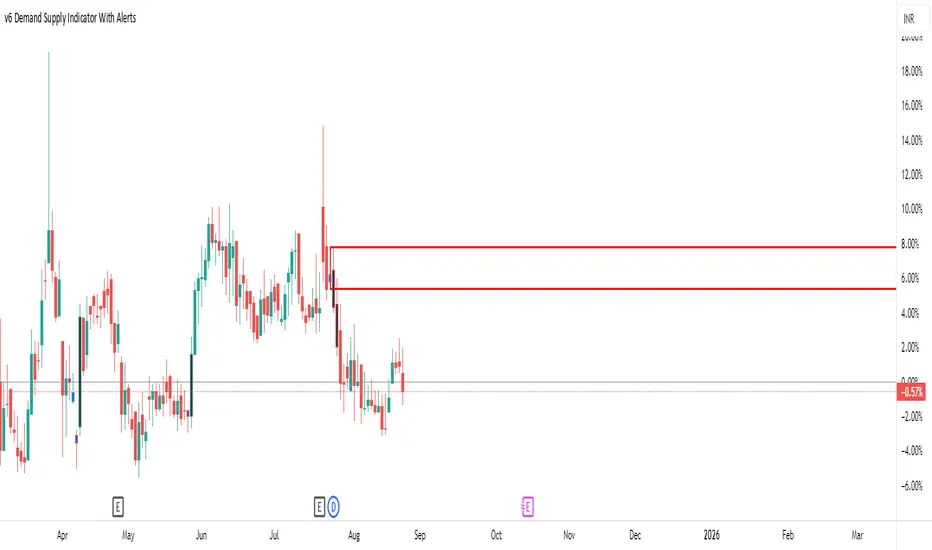
The Demand Supply Zone indicator with Alerts helps in identifying the Demand Supply zones on chart by pinpointing them.
The indicator looks for Demand Zone patterns, Drop-Base-Rally or Rally-Base-Rally, when such pattern is identified the indicator marks it on the chart. Likewise, if the indicator identifies Supply Zone patterns, Rally-Base-Drop or Drop-Base-Drop the indicator marks it as Supply Zone. The basing candles are changed to Blue color and the Legout candles are changed to Black color by default.
Using the Demand Supply Zone Indicator with Alerts you can also set Alerts on your favourite scripts and timeframes, to get notification when Demand Supply Zones are formed.
List of all the features is provided below.
1. You can choose which patterns the indicator should identify.
2. Number of candles in basing from 1 to 6.
3. Strength of the legout.
4. Identify follow-through patterns.
5. Hide Single Legout patterns.
6. Strength of the first legout in follow through pattern.
7. Strength of the second legout in the follow through pattern.
8. Customize Basing Color
9. Customize Legout Color
10. Display Pattern Name
11. Display Proximal and Distal Values
12. Color customization for Demand Supply Zone Labels
13. Set Alerts based on Demand Supply Zone formation
To set Alerts follow the steps provided below.
1. Go to the symbol chart and select the timeframe on which you want to set Alerts.
2. Select Alerts Tab and click on Create Alert, shortcut key Alt+A
3. In Condition Select, Demand Supply Indicator With Alerts
4. In Options, select Once Per Bar Close
5. Select expiry as per your preference or keep it open-ended
6. Select Alerts Actions as per your preference
7. Alert name is optional
8. Default message is “Zone Alert” and can be modified
9. Click on Create and in the warning window select Continue Anyway
Once you have active alert, you will keep getting notification whenever a Demand/Supply zone in identified on the symbol and time frame you selected.
Use the link below to obtain access to this indicator.
ملاحظات الأخبار
Changed default options.ملاحظات الأخبار
Version 3Automatically draws the Demand and Supply zones
ملاحظات الأخبار
Bug Fixملاحظات الأخبار
Option added to change the Proximal Distal Line Widthملاحظات الأخبار
New In Version 41. Option to use the indicator for multiple timeframe analysis.
2. Customize Proximal Distal Line Width
3. Customize Legout color based on Drop or Rally
ملاحظات الأخبار
This update adds cosmetic changes to the indicator. You can now customize the color of 1. Fresh Demand Zone Border
2. Fresh Supply Zone Border
3. Tested Demand Zone Border
4. Tested Supply Zone Border
5. Fresh Demand Zone Fill Color
6. Fresh Supply Zone Fill Color
7. Tested Demand Zone Fill Color
8. Tested Supply Zone Fill Color
You can also customize the zone border width.
ملاحظات الأخبار
Code enhancementملاحظات الأخبار
Bug Fix - If the indicator is already applied to your chart please remove it and add it again. If the indicator name starts with 4.2.1, you have the latest version.ملاحظات الأخبار
Bug fixملاحظات الأخبار
Code optimizationملاحظات الأخبار
Code optimization.New feature to show current settings on the chart top right corner.
ملاحظات الأخبار
Code optimization and grouped options in indicator settings.ملاحظات الأخبار
Code Optimizationملاحظات الأخبار
Version 4.2.5Code optimized and a bug fix.
ملاحظات الأخبار
Features Added in Version 5.01. Automated Curve Analysis.
2. Automated Zone Violations (recent 2 zones)
ملاحظات الأخبار
Curve analysis will not give error even if the zones are far back in history.ملاحظات الأخبار
The following 2 new features have been added1. Option to mark the zone using WickToWick or BodyToWick method.
2. Option to display Proximal and Distal values inside the zone.
ملاحظات الأخبار
Changelog:- New Improved Algorithm for Zone Identification
- Option to select Legin method
- Zones based on GAPS
(NOTE: If you already have an active subscription, please remove the indicator from the chart and add it again to upgrade to the latest version 5.3)
ملاحظات الأخبار
The following feature has been added in version 5.3.21. Zones On Visible Chart Data
2. Auto settings for HTF, ITF, RTF
ملاحظات الأخبار
Now you can input custom time frames for HTF, ITF and RTF.ملاحظات الأخبار
Alerts functionality fixed.ملاحظات الأخبار
"Plot Zones Only On Visible Chart Data" functionality restoredملاحظات الأخبار
Bug Fix for Zone Violationsملاحظات الأخبار
Features Added- Improved Algorithm.
- Option to Enable/Disable Basing and Legout Candle Color.
ملاحظات الأخبار
Bug fixملاحظات الأخبار
Enhancements and bug fixes.نص برمجي للمستخدمين المدعوين فقط
الوصول إلى هذا النص مقيد للمستخدمين المصرح لهم من قبل المؤلف وعادة ما يكون الدفع مطلوباً. يمكنك إضافته إلى مفضلاتك، لكن لن تتمكن من استخدامه إلا بعد طلب الإذن والحصول عليه من مؤلفه. تواصل مع SurjeetKakkar للحصول على مزيد من المعلومات، أو اتبع إرشادات المؤلف أدناه.
لا تقترح TradingView الدفع مقابل النصوص البرمجية واستخدامها حتى تثق بنسبة 100٪ في مؤلفها وتفهم كيفية عملها. في كثير من الحالات، يمكنك العثور على بديل جيد مفتوح المصدر مجانًا في نصوص مجتمع الخاصة بنا .
تعليمات المؤلف
″You can subscribe for the Indicator from our website, the link is provided below
هل تريد استخدام هذا النص البرمجي على الرسم البياني؟
تحذير: يرجى القراءة قبل طلب الوصول.
إخلاء المسؤولية
لا يُقصد بالمعلومات والمنشورات أن تكون، أو تشكل، أي نصيحة مالية أو استثمارية أو تجارية أو أنواع أخرى من النصائح أو التوصيات المقدمة أو المعتمدة من TradingView. اقرأ المزيد في شروط الاستخدام.