OPEN-SOURCE SCRIPT
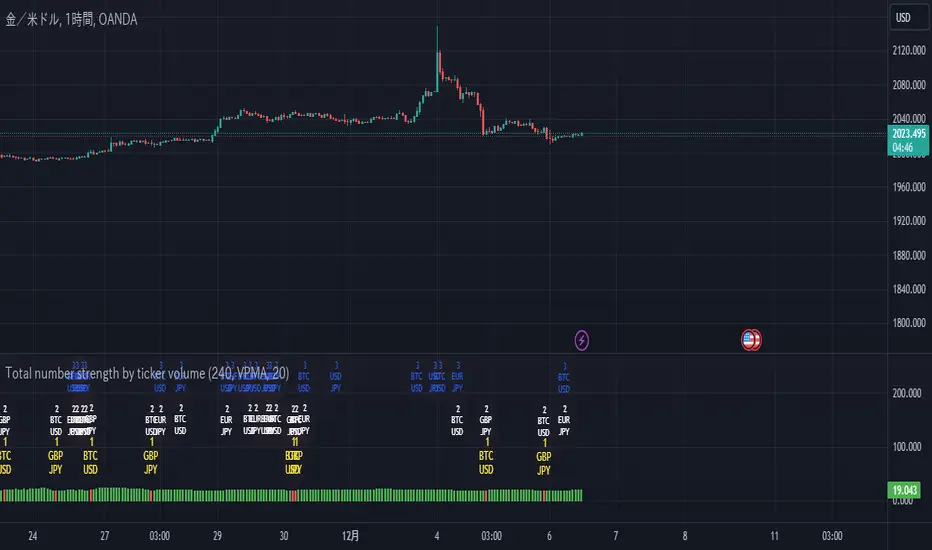
Total number strength by ticker volume

This is about stocks, which I always analyze.
Figure this out by looking at what the code calls ta.secutity.
This indicator plots the highest value of the ratio of total volume to individual volume for the stock you are analyzing, and the histogram tumbles to red when the stock changes in that value. The changed value is plotted as a label above that histogram. By using this indicator, you can determine which is currently the focus of attention, and if there are outliers, you will know by the histogram's detachment.
The parameters are explained below, but Timefream is the market value to be determined
setvalue sets the item to be judged, and lenght sets the time period to be judged. setvalue is the parameter that determines the timeframe for the judgment. vol is the volume, VP is the total purchase price, VPMA is its average, VPMAD is the detachment from its average, MA is the average of the vol, MAD is the detachment from its average, LRC is the average of the vol, and LRC is the average of the vol. value of linear regression, and also
The calculation of detachment is not negative because it comes out as a square, but it is not a problem because it is calculated as a percentage.
There is a *problem, and if the timefreame to be displayed is not calculated below the value of timefreame, an error will occur. We are currently searching for a solution to this problem. If you know the solution, I would appreciate it if you could let me know in the chat.
نص برمجي مفتوح المصدر
بروح TradingView الحقيقية، قام مبتكر هذا النص البرمجي بجعله مفتوح المصدر، بحيث يمكن للمتداولين مراجعة وظائفه والتحقق منها. شكرا للمؤلف! بينما يمكنك استخدامه مجانًا، تذكر أن إعادة نشر الكود يخضع لقواعد الموقع الخاصة بنا.
إخلاء المسؤولية
لا يُقصد بالمعلومات والمنشورات أن تكون، أو تشكل، أي نصيحة مالية أو استثمارية أو تجارية أو أنواع أخرى من النصائح أو التوصيات المقدمة أو المعتمدة من TradingView. اقرأ المزيد في شروط الاستخدام.