OPEN-SOURCE SCRIPT
تم تحديثه Juice Levels
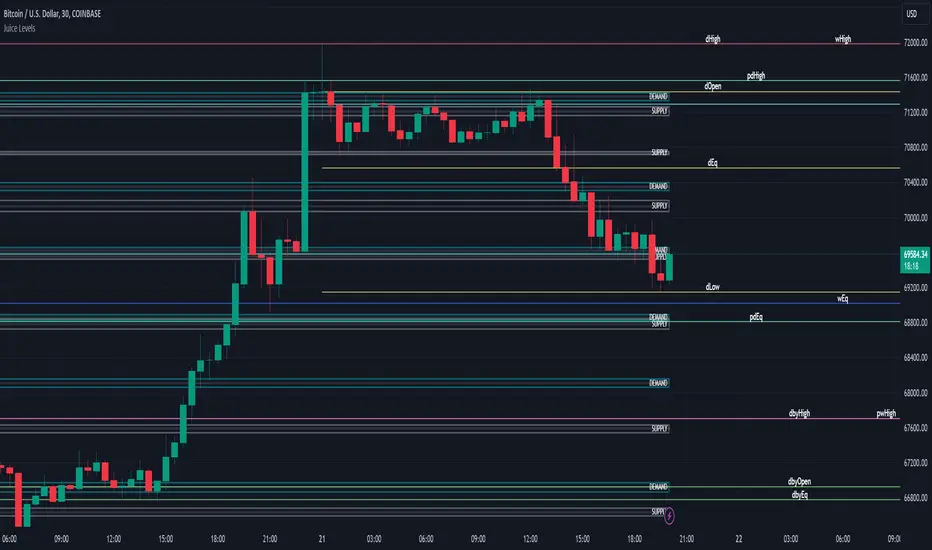
Supply and Demand Key Levels
These levels encompass key price points derived from various timeframes, providing crucial insights into market dynamics and potential trading opportunities. These levels include daily, prior day, day before yesterday, weekly, prior weekly, monthly, and prior monthly levels.
Daily, Prior Day, Day Before Yesterday Levels
Offer intraday reference points and historical context for analyzing short-term price movements.
Weekly, Prior Weekly Levels
Provide insights into longer-term trends and potential areas of price consolidation or breakout over a one-week timeframe.
Monthly, Prior Monthly Levels
Offer significant insights into macroeconomic trends and investor sentiment over longer timeframes, spanning one month.
Equilibrium Levels
Indicate points where supply and demand are relatively balanced, often serving as pivot points for price movements.
Supply and Demand Zones
Highlight areas on a price chart where significant buying or selling pressure is expected, aiding traders in identifying potential reversal or breakout zones.
These levels and zones are essential tools for traders to analyze market sentiment, identify support and resistance levels, and make informed trading decisions across various timeframes.
ملاحظات الأخبار
- Added options to enable / disable every line per periodنص برمجي مفتوح المصدر
بروح TradingView الحقيقية، قام مبتكر هذا النص البرمجي بجعله مفتوح المصدر، بحيث يمكن للمتداولين مراجعة وظائفه والتحقق منها. شكرا للمؤلف! بينما يمكنك استخدامه مجانًا، تذكر أن إعادة نشر الكود يخضع لقواعد الموقع الخاصة بنا.
- Juice Signals™
إخلاء المسؤولية
لا يُقصد بالمعلومات والمنشورات أن تكون، أو تشكل، أي نصيحة مالية أو استثمارية أو تجارية أو أنواع أخرى من النصائح أو التوصيات المقدمة أو المعتمدة من TradingView. اقرأ المزيد في شروط الاستخدام.
نص برمجي مفتوح المصدر
بروح TradingView الحقيقية، قام مبتكر هذا النص البرمجي بجعله مفتوح المصدر، بحيث يمكن للمتداولين مراجعة وظائفه والتحقق منها. شكرا للمؤلف! بينما يمكنك استخدامه مجانًا، تذكر أن إعادة نشر الكود يخضع لقواعد الموقع الخاصة بنا.
- Juice Signals™
إخلاء المسؤولية
لا يُقصد بالمعلومات والمنشورات أن تكون، أو تشكل، أي نصيحة مالية أو استثمارية أو تجارية أو أنواع أخرى من النصائح أو التوصيات المقدمة أو المعتمدة من TradingView. اقرأ المزيد في شروط الاستخدام.