liquidation Heatmap [by Alpha_Precision_Charts]
Overview
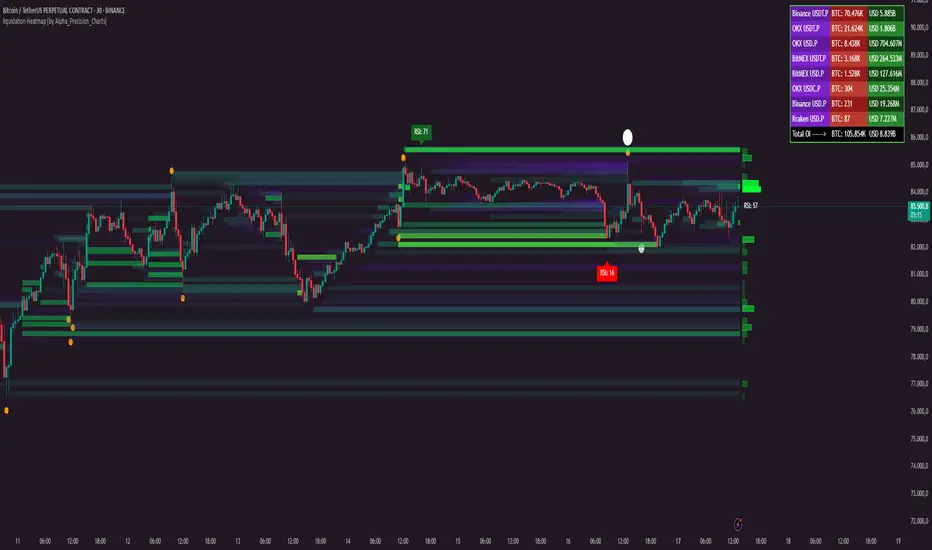
The "Heatmap Longs/Shorts with OI Sensitivity & Aggregated Tools" is an advanced, multi-functional indicator crafted for futures traders seeking a deeper understanding of market dynamics. This tool integrates several key features—Heatmap of Longs and Shorts with Open Interest (OI) sensitivity, Histograms, Liquidity Exit Bubbles, Volume Bubbles, RSI Labels, Moving Averages, and an OI Table—into a single, cohesive package. By pulling real-time OI data from major exchanges (Binance, BitMEX, OKX, Kraken), it offers a robust framework for analyzing liquidity, order flow, momentum, and trends across various timeframes.
Why Aggregation Matters
Market analysis thrives on combining diverse insights, as relying on a single tool often leaves gaps in understanding. Each component of this indicator addresses a distinct aspect of market behavior:
Heatmap Longs/Shorts with OI Sensitivity: Maps potential liquidation zones based on OI, pinpointing where leveraged positions might cluster.
Histograms: Visualize the density of potential liquidity across price levels, enhancing OI-based analysis.
OI Table: Provides a breakdown of OI across all supported exchanges, offering transparency into total market exposure.
Liquidity Exit Bubbles: Highlight significant position exits (negative OI delta), signaling potential reversals or liquidations.
Volume Bubbles: Detect high-volume events from perpetual futures, revealing aggressive market participation.
RSI Labels: Track momentum with overbought and oversold conditions, refining entry and exit timing.
Moving Averages: Establish trend direction and dynamic support/resistance levels.
The power of aggregation lies in its ability to connect these dots. For instance, the Heatmap identifies potential liquidation zones, Volume Bubbles confirm aggressive moves, and RSI Labels add momentum context. Histograms and the OI Table further enrich this by detailing liquidity density and market exposure, creating a comprehensive view critical for navigating volatile markets.
Key Features
Heatmap Longs/Shorts with OI Sensitivity
Displays potential liquidation levels above (Shorts) and below (Longs) the price, with leverage settings from 5x to 125x.
Includes a Minimum Liquidity Sensitivity filter (0.1-1.0) to exclude small-order noise.
Features a dynamic gradient (purple to yellow) with adjustable intensity based on OI.
Note: Exact trader leverage isn’t known; liquidation zones are inferred from market psychology, as traders often favor specific leverage levels (e.g., 25x, 50x, 125x).
Histograms
Display the density of potential liquidity across price levels, complementing the Heatmap. Note that the largest histogram bars may appear in different locations compared to the most intense (yellow) areas of the Heatmap, as histograms primarily focus on the accumulation of smaller orders.
OI Table
Aggregates OI data from all supported exchanges (Binance, BitMEX, OKX, Kraken) in base currency and USD, sortable by volume.
Displays total OI and individual exchange contributions automatically.
Liquidity Exit Bubbles
Plots bubbles for significant negative OI changes, sized as small, medium, or large based on magnitude.
Positioned above or below candles depending on volatility direction, with customizable colors.
Volume Bubbles
Marks high-volume activity from perpetual futures, with sizes (normal, high, ultra-high) tied to intensity.
Offers adjustable sensitivity and offset for precise placement.
RSI Labels
Provides real-time RSI readings, highlighting overbought (≥70) and oversold (≤30) levels.
Configurable by price source (e.g., High/Low, Close) and timeframe, with customizable appearance.
Moving Averages
Supports SMA, EMA, WMA, and VWMA with three user-defined periods (default: 21, 50, 100).
Toggleable visibility and colors for trend analysis.
How to Use
Scalping/Day Trading (1m-15m):
Load the indicator three times: one at 125x leverage (visible), one at 50x (hidden), and one at 25x (hidden). Use the 125x Heatmap to identify immediate liquidation zones. When price breaks through the 125x liquidity pool, enable the 50x instance, then 25x as needed, to track cascading liquidations.
Pair with Histograms to monitor potential liquidity density, Volume Bubbles for breakout signals, and Liquidity Exit Bubbles for reversals.
Check RSI Labels on short timeframes (e.g., 15m) for overextended moves.
Swing Trading (1H-4H):
Set the Heatmap to lower leverage (e.g., 25x, 10x) and combine with Moving Averages to confirm trends.
Use RSI Labels on matching timeframes to time entries/exits based on momentum.
Reference the OI Table to assess overall market exposure.
Liquidity Analysis:
Adjust the Minimum Liquidity Sensitivity to focus on significant OI clusters. Higher filtering removes small orders, so use Volume Bubbles and the OI Table for broader context in sideways markets.
Use the OI Table to see total OI across all exchanges.
General Tips:
Toggle features (e.g., Bubbles, MAs) to focus on relevant data.
Test settings on your asset—optimized for Bitcoin, adjustable for altcoins.
Settings
Exchanges: Data from Binance, BitMEX, OKX, and Kraken is automatically included.
Heatmap: Enable Longs/Shorts, set start date, adjust leverage and color intensity.
Liquidity Filtering: Tune Minimum Liquidity Sensitivity (0.1-1.0) to balance detail and noise.
Histograms: Automatically active, showing potential liquidity density; no direct settings.
OI Table: Toggle visibility and choose position (e.g., Top Right).
Bubbles: Enable/disable Liquidity Exit and Volume Bubbles, set sensitivities and colors.
RSI: Pick price source, timeframe, and label style (size, color, offset).
Moving Averages: Select type, periods, and visibility.
Why It’s Unique
This indicator blends liquidity tools (Heatmap, Histograms, OI Table, Bubbles) with momentum and trend analysis (RSI, MAs). The adjustable Heatmap intensity enhances visibility of significant OI levels, while the multi-tool approach provides a fuller market perspective.
Notes
Best suited for perpetual futures; test on spot or other instruments for compatibility.
High leverage (e.g., 125x) excels on short timeframes; use 5x-25x for daily/weekly views.
Experiment with settings to optimize for your asset and timeframe.
This indicator relies on the availability of Open Interest (OI) data from TradingView. Functionality may vary depending on data access for your chosen asset and exchange.
Feedback
Your input is valued to enhance this tool. Enjoy trading with a fuller market perspective!
نص برمجي للمستخدمين المدعوين فقط
يمكن فقط للمستخدمين الذين تمت الموافقة عليهم من قبل المؤلف الوصول إلى هذا البرنامج النصي. ستحتاج إلى طلب الإذن والحصول عليه لاستخدامه. يتم منح هذا عادةً بعد الدفع. لمزيد من التفاصيل، اتبع تعليمات المؤلف أدناه أو اتصل ب Alpha_Precision_Charts مباشرة.
لا توصي TradingView بالدفع مقابل برنامج نصي أو استخدامه إلا إذا كنت تثق تمامًا في مؤلفه وتفهم كيفية عمله. يمكنك أيضًا العثور على بدائل مجانية ومفتوحة المصدر في نصوص مجتمعنا.
تعليمات المؤلف
إخلاء المسؤولية
نص برمجي للمستخدمين المدعوين فقط
يمكن فقط للمستخدمين الذين تمت الموافقة عليهم من قبل المؤلف الوصول إلى هذا البرنامج النصي. ستحتاج إلى طلب الإذن والحصول عليه لاستخدامه. يتم منح هذا عادةً بعد الدفع. لمزيد من التفاصيل، اتبع تعليمات المؤلف أدناه أو اتصل ب Alpha_Precision_Charts مباشرة.
لا توصي TradingView بالدفع مقابل برنامج نصي أو استخدامه إلا إذا كنت تثق تمامًا في مؤلفه وتفهم كيفية عمله. يمكنك أيضًا العثور على بدائل مجانية ومفتوحة المصدر في نصوص مجتمعنا.