OPEN-SOURCE SCRIPT
تم تحديثه Upside Downside Unchanged Volume
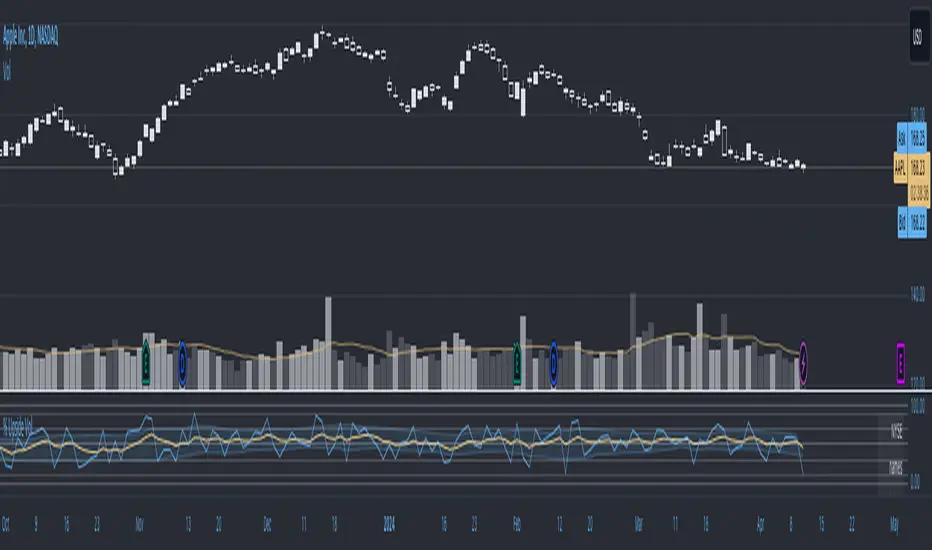
Upside Downside Unchanged Volume
- Plot NYSE or NASDAQ Upside Volume, Downside Volume, or Unchanged Volume (e.g. UPVOL.NY, UVOL, or ADVN.NY) as a percent (values 0 to 1, where 1 = 100%) of Total Volume.
- Plot Day, Week, and Month volume and/or chart timeframe period volume.
- Plot volume as a histogram, line, or area.
- Plot various moving averages of volume points.
- Horizontal lines at 0, 10, 30, 50, 70, 90, and 100% levels.
- Inspired by Paul Desmond of Lowry’s Reports.
ملاحظات الأخبار
Updated script notes:- Plot NYSE or NASDAQ Upside Volume, Downside Volume, or Unchanged Volume as a percent of Total Volume.
- Values are plotted 0 to 1, where 1 = 100%.
- Example of variables: USI:UPVOL.NY/DNVOL.NY/UNCHVOL.NY vs USI:TVOL.NY (Volume), USI:UVOL/DVOL/XVOL vs USI:TVOL (Volume), and USI:ADVN.NY/DECL.NY/UNCH.NY vs USI:ACTV.NY (Issues)
- Plot Day, Week, and Month volume and/or chart timeframe period volume.
- Plot volume as a histogram, line, or area.
- Plot various moving averages of volume points.
- Horizontal lines at 0, .10, .30, .50, .70, .90, and 1.00 levels.
- Inspired by Paul Desmond of Lowry’s Reports.
ملاحظات الأخبار
Added moving averages from values above or below a specified % of total volume.ملاحظات الأخبار
Changed settings titlesملاحظات الأخبار
Added notes.ملاحظات الأخبار
fixed errorsملاحظات الأخبار
Edited section headingsملاحظات الأخبار
added a table to report the current percent up or downملاحظات الأخبار
edited tableملاحظات الأخبار
changed colors and defaultsملاحظات الأخبار
Corrected an error in the code.نص برمجي مفتوح المصدر
بروح TradingView الحقيقية، قام مبتكر هذا النص البرمجي بجعله مفتوح المصدر، بحيث يمكن للمتداولين مراجعة وظائفه والتحقق منها. شكرا للمؤلف! بينما يمكنك استخدامه مجانًا، تذكر أن إعادة نشر الكود يخضع لقواعد الموقع الخاصة بنا.
إخلاء المسؤولية
لا يُقصد بالمعلومات والمنشورات أن تكون، أو تشكل، أي نصيحة مالية أو استثمارية أو تجارية أو أنواع أخرى من النصائح أو التوصيات المقدمة أو المعتمدة من TradingView. اقرأ المزيد في شروط الاستخدام.
نص برمجي مفتوح المصدر
بروح TradingView الحقيقية، قام مبتكر هذا النص البرمجي بجعله مفتوح المصدر، بحيث يمكن للمتداولين مراجعة وظائفه والتحقق منها. شكرا للمؤلف! بينما يمكنك استخدامه مجانًا، تذكر أن إعادة نشر الكود يخضع لقواعد الموقع الخاصة بنا.
إخلاء المسؤولية
لا يُقصد بالمعلومات والمنشورات أن تكون، أو تشكل، أي نصيحة مالية أو استثمارية أو تجارية أو أنواع أخرى من النصائح أو التوصيات المقدمة أو المعتمدة من TradingView. اقرأ المزيد في شروط الاستخدام.