INVITE-ONLY SCRIPT
Random Walk Simulation
Understanding the Random Walk Simulation
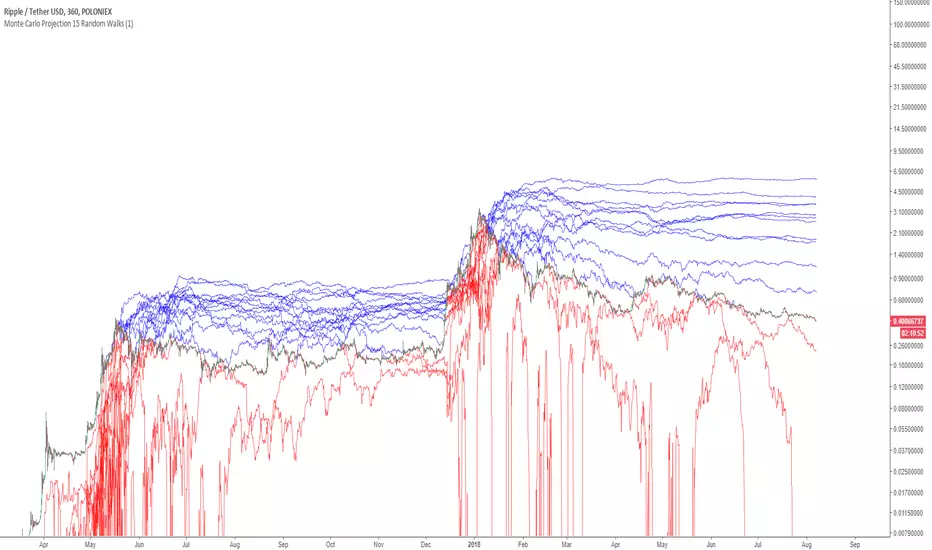
This indicator randomly generates alternative price outcomes derived from the price movements of the underlying security. Monte Carlo methods rely on repeated random sampling to create a data set that has the same characteristics as the sample source, representing examples of alternate outcomes. The data set created using random sampling is called a “random walk”.
First, every bar in the time stamp is measured and put into a logarithmic population. Then, a sample is drawn at random from the population and is used to determine the next price movement of the random walk. This process is repeated fifteen times to visualise whether the alternative outcomes lie above or beneath the current market price of the security.
Random Walk Utility
The random walk generator allows users of the Monte Carlo to further understand how the Monte Carlo projection is generated by creating a visual representation of individual random walks. Trends that occur on the random walks may correlate to the historical price action of the underlying security.
You can find the Monte Carlo Simulator here:
Input Values
Select the “Format”, button located next to the indicator label to adjust the input values and the style.
The Random Walk indicator only has one user-defined input value that can be changed.
The Random_Variable randomises a set of random walks. If this variable is changed, it will run a fresh set of 15 random walks which will result in a slightly different outcome.
Adding the indicator to your chart multiple times using many different random variables will allow you to achieve a more accurate reading. Ideally, the Monte Carlo Simulator takes an average of these to be interpreted.

For more information on this indicator, the full PDF can be found here: kenzing.com/product/random-walks/
This indicator randomly generates alternative price outcomes derived from the price movements of the underlying security. Monte Carlo methods rely on repeated random sampling to create a data set that has the same characteristics as the sample source, representing examples of alternate outcomes. The data set created using random sampling is called a “random walk”.
First, every bar in the time stamp is measured and put into a logarithmic population. Then, a sample is drawn at random from the population and is used to determine the next price movement of the random walk. This process is repeated fifteen times to visualise whether the alternative outcomes lie above or beneath the current market price of the security.
Random Walk Utility
The random walk generator allows users of the Monte Carlo to further understand how the Monte Carlo projection is generated by creating a visual representation of individual random walks. Trends that occur on the random walks may correlate to the historical price action of the underlying security.
You can find the Monte Carlo Simulator here:
Input Values
Select the “Format”, button located next to the indicator label to adjust the input values and the style.
The Random Walk indicator only has one user-defined input value that can be changed.
The Random_Variable randomises a set of random walks. If this variable is changed, it will run a fresh set of 15 random walks which will result in a slightly different outcome.
Adding the indicator to your chart multiple times using many different random variables will allow you to achieve a more accurate reading. Ideally, the Monte Carlo Simulator takes an average of these to be interpreted.
For more information on this indicator, the full PDF can be found here: kenzing.com/product/random-walks/
نص برمجي للمستخدمين المدعوين فقط
الوصول إلى هذا النص مقيد للمستخدمين المصرح لهم من قبل المؤلف وعادة ما يكون الدفع مطلوباً. يمكنك إضافته إلى مفضلاتك، لكن لن تتمكن من استخدامه إلا بعد طلب الإذن والحصول عليه من مؤلفه. تواصل مع GrantPeace للحصول على مزيد من المعلومات، أو اتبع إرشادات المؤلف أدناه.
لا تقترح TradingView الدفع مقابل النصوص البرمجية واستخدامها حتى تثق بنسبة 100٪ في مؤلفها وتفهم كيفية عملها. في كثير من الحالات، يمكنك العثور على بديل جيد مفتوح المصدر مجانًا في نصوص مجتمع الخاصة بنا .
تعليمات المؤلف
″
هل تريد استخدام هذا النص البرمجي على الرسم البياني؟
تحذير: يرجى القراءة قبل طلب الوصول.
Kenzing trading indicators for TradingView perform advanced real-time analysis of stock price trends and display alerts that are easy for the average Trader to interpret.
kenzing.com
kenzing.com
إخلاء المسؤولية
لا يُقصد بالمعلومات والمنشورات أن تكون، أو تشكل، أي نصيحة مالية أو استثمارية أو تجارية أو أنواع أخرى من النصائح أو التوصيات المقدمة أو المعتمدة من TradingView. اقرأ المزيد في شروط الاستخدام.