PROTECTED SOURCE SCRIPT
تم تحديثه TRADE ORBIT : SCALPING STRATEGIES-1
📘 Description – Stochastic + EMA/SMA + OBV Filtered Buy/Sell (First Signal Only)
This indicator combines Stochastic momentum, EMA/SMA trend filters, and OBV volume confirmation to generate high-quality first Buy/Sell signals after confirmed reversals.
🔍 Core Components
Stochastic (140,30,30):
When %K > %D → Blue background (bullish momentum)
When %K < %D → Black background (bearish momentum)
EMA/SMA Trend Filters:
EMA 9, EMA 30, EMA 100 → Identify short-, mid-, and long-term trend alignment.
SMA 34 (High/Low) → Define dynamic trend channel or range levels.
OBV (On-Balance Volume) Filter:
Calculates cumulative buying/selling pressure.
Buy condition: OBV > SMA(50) of OBV
Sell condition: OBV < SMA(50) of OBV
💡 Filtered Signal Logic
The script plots only the first Buy or Sell signal after a confirmed reversal.
Repeated signals in the same direction are suppressed until an opposite signal appears.
Helps reduce noise and false triggers during sideways markets.
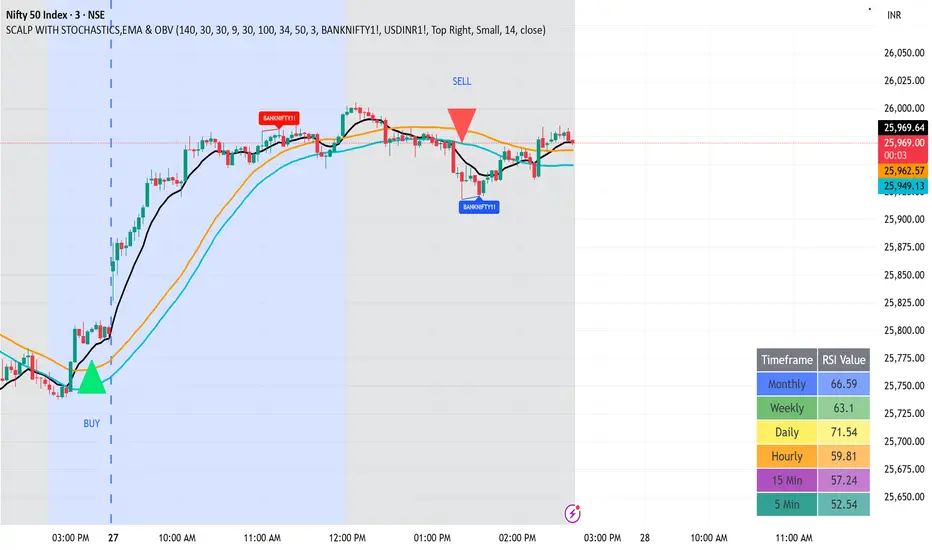
🎨 Visual Elements
Background: Blue for bullish (%K > %D), Black for bearish (%K < %D).
Buy Signal: Green triangle below bar (first after bearish trend).
Sell Signal: Red triangle above bar (first after bullish trend).
Plots: EMA9 (yellow), EMA30 (teal), EMA100 (red), SMA34 High (orange), SMA34 Low (aqua).
🧭 Usage Tips
Look for Buy signals during blue backgrounds and when price is above EMA30/EMA100.
Look for Sell signals during black backgrounds and when price is below EMA30/EMA100.
Combine with higher-timeframe trend confirmation for stronger setups.
USE IN 3/5/10/15 MIN TIME FRAME
TARGET MIN 20 TO 30 POINT
This indicator combines Stochastic momentum, EMA/SMA trend filters, and OBV volume confirmation to generate high-quality first Buy/Sell signals after confirmed reversals.
🔍 Core Components
Stochastic (140,30,30):
When %K > %D → Blue background (bullish momentum)
When %K < %D → Black background (bearish momentum)
EMA/SMA Trend Filters:
EMA 9, EMA 30, EMA 100 → Identify short-, mid-, and long-term trend alignment.
SMA 34 (High/Low) → Define dynamic trend channel or range levels.
OBV (On-Balance Volume) Filter:
Calculates cumulative buying/selling pressure.
Buy condition: OBV > SMA(50) of OBV
Sell condition: OBV < SMA(50) of OBV
💡 Filtered Signal Logic
The script plots only the first Buy or Sell signal after a confirmed reversal.
Repeated signals in the same direction are suppressed until an opposite signal appears.
Helps reduce noise and false triggers during sideways markets.
🎨 Visual Elements
Background: Blue for bullish (%K > %D), Black for bearish (%K < %D).
Buy Signal: Green triangle below bar (first after bearish trend).
Sell Signal: Red triangle above bar (first after bullish trend).
Plots: EMA9 (yellow), EMA30 (teal), EMA100 (red), SMA34 High (orange), SMA34 Low (aqua).
🧭 Usage Tips
Look for Buy signals during blue backgrounds and when price is above EMA30/EMA100.
Look for Sell signals during black backgrounds and when price is below EMA30/EMA100.
Combine with higher-timeframe trend confirmation for stronger setups.
USE IN 3/5/10/15 MIN TIME FRAME
TARGET MIN 20 TO 30 POINT
ملاحظات الأخبار
USE IN 3/5/10/15 MIN TIME FRAMETARGET MIN 20 TO 30 POINT
RSI TABLE AVAILABLE
نص برمجي محمي
تم نشر هذا النص البرمجي كمصدر مغلق. ومع ذلك، يمكنك استخدامه بحرية ودون أي قيود - تعرف على المزيد هنا.
إخلاء المسؤولية
لا يُقصد بالمعلومات والمنشورات أن تكون، أو تشكل، أي نصيحة مالية أو استثمارية أو تجارية أو أنواع أخرى من النصائح أو التوصيات المقدمة أو المعتمدة من TradingView. اقرأ المزيد في شروط الاستخدام.