OPEN-SOURCE SCRIPT
MTF Wave Trend & Money Flow - Monitoring Panel
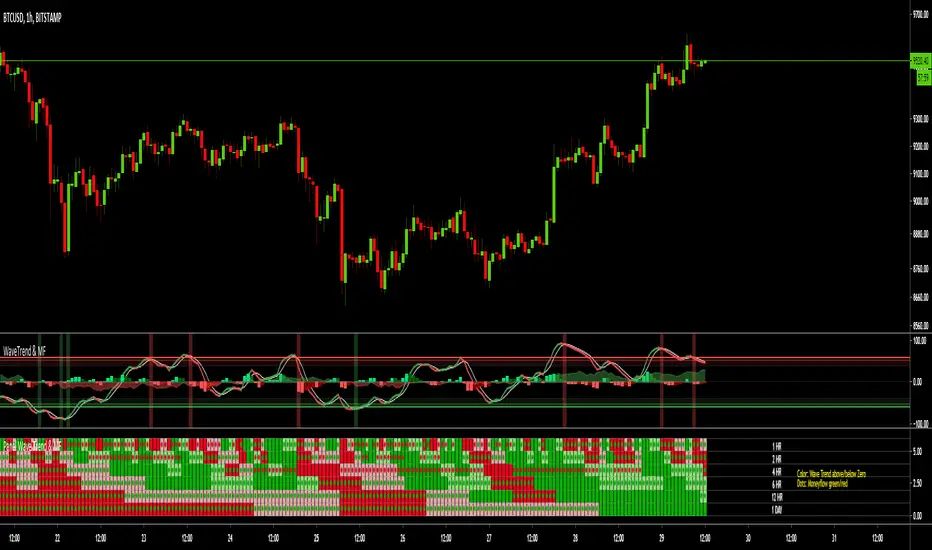
Another indicator based on the famous "Wave Trend Oscillator" by LazyBear.
Monitoring panel showing the Wave Trend as color for 6 different timeframes. Additionaly the Money Flow (positive or negative) is indicated as green or red dots.
I find it helpful that with one glance the current Wave Trend and Money Flow on many timeframes is visible.
(Timeframes can be changed, but the description labels are currently hardcoded - if you want to change it, just copy the script and change them)
Meanings of the Colors:
WT above Zero and rising : Dark Green
WT above Zero and declining : Light Green
WT below Zero and declining : Dark Red
WT below Zero and rising : Light Red
Money flow positive : Green dot
Monet flow negative : Red dot
(Currently there are two additional timeframes commented in the code - if you want to use them, just copy the script and uncomment them)
Have fun and as always I am open for constructive feedback.
Cheers!
نص برمجي مفتوح المصدر
بروح TradingView الحقيقية، قام مبتكر هذا النص البرمجي بجعله مفتوح المصدر، بحيث يمكن للمتداولين مراجعة وظائفه والتحقق منها. شكرا للمؤلف! بينما يمكنك استخدامه مجانًا، تذكر أن إعادة نشر الكود يخضع لقواعد الموقع الخاصة بنا.
The new Order Block Finder V2 is available as invite-only script. Please visit the website for all the details and how to get access:
sites.google.com/view/wugamlo-indicators/
sites.google.com/view/wugamlo-indicators/
إخلاء المسؤولية
لا يُقصد بالمعلومات والمنشورات أن تكون، أو تشكل، أي نصيحة مالية أو استثمارية أو تجارية أو أنواع أخرى من النصائح أو التوصيات المقدمة أو المعتمدة من TradingView. اقرأ المزيد في شروط الاستخدام.