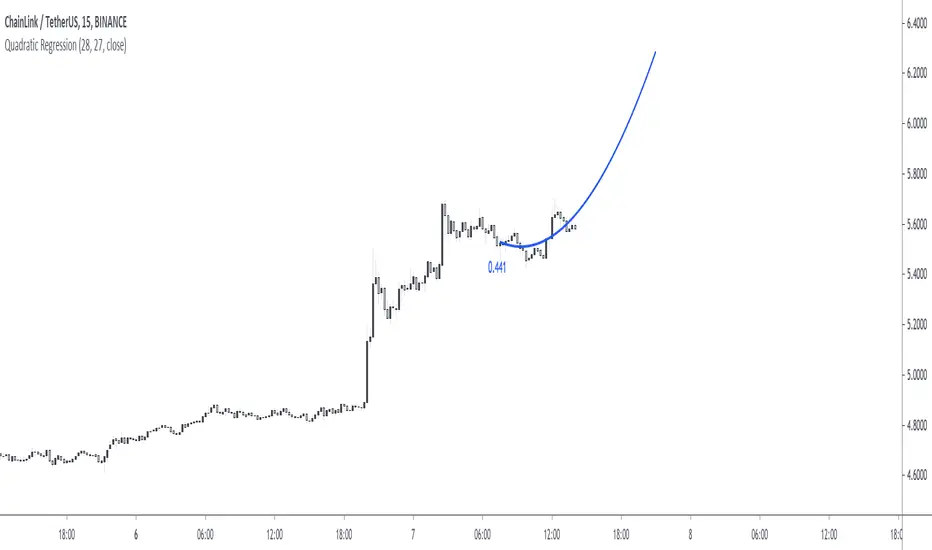
Fit a quadratic polynomial (parabola) to the last length data points by minimizing the sum of squares between the data and the fitted results. The script can extrapolate the results in the future and can also display the R-squared of the model. Note that this script is subject to some limitations (more in the "Notes" section).
Settings
Settings
- Length : Number of data points to use as input.
- Offset : Determine the number of past fitted values to be displayed, if 0 only the extrapolated values are displayed, if 55 only the past fitted values are displayed.
- Src : Input data of the indicator
- Show R2 : Determine if the value of the R-squared must be displayed, by default true.
Usage
When the underlying trend in the price is not linear, we might use more advanced models to estimate it, this is where using a higher-degree regression model might be required, as such a quadratic model (second-degree) is appropriate when the underlying trend is parabolic.
Here we can see that the quadratic regression (in blue) offer a better fit than a linear one.
Another advantage of the quadratic regression is that a linear one will always have the same direction, that's not the case with the quadratic regression and as such, it is possible to forecast reversals.
Above a linear regression (in red) and two quadratic regression (in blue) with both length = 54. Note that for the sake of clarity, the above image uses a quadratic regression to show all the past fitted values and another one to show all the forecasted values.
The R-Squared is also extremely useful when it comes to measuring the accuracy of the model, with values closer to 1 indicating that the model is appropriate, and thus suggesting that the underlying trend in the price is parabolic. The R-squared can also measure the strength of the trend.
Notes
The script uses the function line.new, as such only a maximum of 54 observations are displayed, getting more observations can be done by using an additional quadratic regression like we did in the previous section. Another thing is that line.new use xloc.bar_time, as such it is possible to observe some errors with the displayed results of the indicator, such as:
This will happen when applying the indicator to symbols with session breaks, I apologize for this inconvenience and I'll try to find solutions. Note however that the indicator will work perfectly on cryptos.
Summary
That's an indicator I really wanted to make, even if it is important to note that such models are rarely useful in stock markets, however it is more than possible to create a quadratic regression (with severe limitations) with pinescript.
Today I turn 21, while I should be celebrating I still wanted to share something with the community, it's also some kind of present to myself that tells me that I am a bit better at using pinescript than last year, and I am glad I could progress (instead of regress, regression, got it?). Thx a lot for reading!
نص برمجي مفتوح المصدر
بروح TradingView الحقيقية، قام مبتكر هذا النص البرمجي بجعله مفتوح المصدر، بحيث يمكن للمتداولين مراجعة وظائفه والتحقق منها. شكرا للمؤلف! بينما يمكنك استخدامه مجانًا، تذكر أن إعادة نشر الكود يخضع لقواعد الموقع الخاصة بنا.
Check out the indicators we are making at luxalgo: tradingview.com/u/LuxAlgo/
"My heart is so loud that I can't hear the fireworks"
"My heart is so loud that I can't hear the fireworks"
إخلاء المسؤولية
لا يُقصد بالمعلومات والمنشورات أن تكون، أو تشكل، أي نصيحة مالية أو استثمارية أو تجارية أو أنواع أخرى من النصائح أو التوصيات المقدمة أو المعتمدة من TradingView. اقرأ المزيد في شروط الاستخدام.
