PROTECTED SOURCE SCRIPT
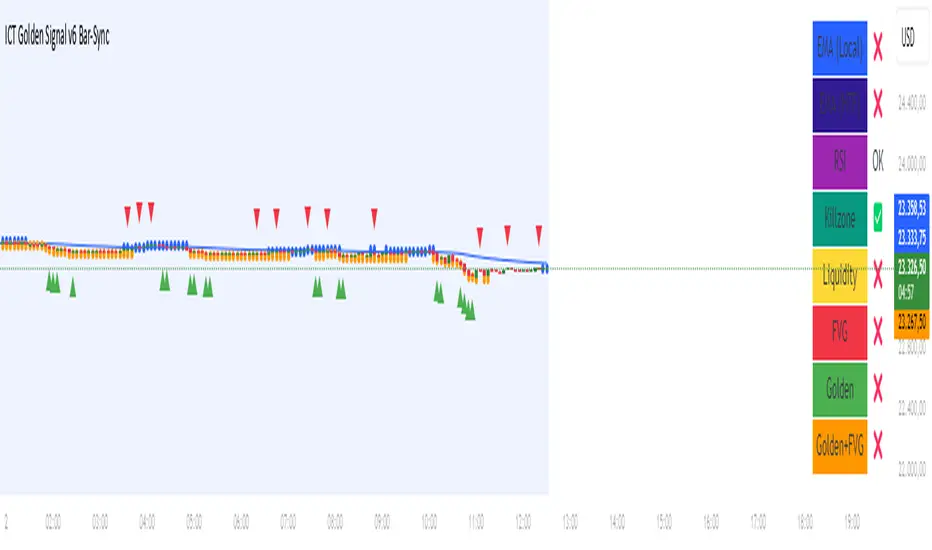
ICT Golden Signal v6 Bar-Sync
1️⃣ EMA (Exponential Moving Average)
Blue line: Local EMA (50 periods).
Dashboard: “EMA (Local)” → ✅ price above EMA, ❌ below EMA.
HTF EMA (1H): Shows higher timeframe trend, displayed in the dashboard.
Meaning:
Price above EMA → overall trend is up.
Price below EMA → overall trend is down.
2️⃣ RSI (Relative Strength Index)
RSI Overbought / Oversold levels: 70 and 30.
Dashboard:
OB → RSI is overbought
OS → RSI is oversold
OK → normal range
Meaning:
RSI crossing above OS → potential buy signal.
RSI crossing below OB → potential sell signal.
3️⃣ Equal High / Equal Low (Liquidity Levels)
Orange line: Equal Low (equal bottoms)
Blue line: Equal High (equal tops)
Yellow arrows / plotchar:
▲ Break below bottom → possible Stop Hunt Short
▼ Break above top → possible Stop Hunt Long
Meaning:
These are liquidity collection points in the market.
Stop Hunt may occur here → prerequisite for Golden Signal.
4️⃣ Fair Value Gap (FVG)
Green ▲ → FVG upward (buy opportunity)
Red ▼ → FVG downward (sell opportunity)
Dashboard “FVG” → ✅ price is within FVG, ❌ outside
Meaning:
Market often fills the price gap.
Golden Signal + FVG → strong entry opportunity.
5️⃣ Killzones
London: 03:00–05:00
New York: 08:30–10:30
Dashboard → ✅ trading session active, ❌ outside session
Meaning:
Strategy only generates signals during killzones.
Signals outside these times are ignored.
6️⃣ Entry and Golden Signals
B (green) → normal Long Entry
S (red) → normal Short Entry
★ (lime/maroon) → Golden Long / Short
🔥 (teal/purple) → Golden + FVG
Meaning:
Golden Signal → Stop Hunt + EMA trend + RSI conditions met.
Golden + FVG → top-level buy/sell opportunity, very strong signal.
7️⃣ Dashboard
Top-right table shows all indicator conditions at a glance:
EMA local / HTF
RSI status
Killzone status
Liquidity (Stop Hunt)
FVG status
Golden & Golden + FVG status
Benefit:
You can quickly see all information in one place instead of searching through the chart.
Summary
Trend determined by EMA.
Momentum checked with RSI.
Equal High/Low → liquidity and Stop Hunt points.
FVG → price gaps.
Killzones → signals only during certain hours.
Golden / Golden + FVG → strongest entry opportunities.
Dashboard → all signals and conditions at a glance.
نص برمجي محمي
تم نشر هذا النص البرمجي كمصدر مغلق. ومع ذلك، يمكنك استخدامه بحرية ودون أي قيود - تعرف على المزيد هنا.
إخلاء المسؤولية
لا يُقصد بالمعلومات والمنشورات أن تكون، أو تشكل، أي نصيحة مالية أو استثمارية أو تجارية أو أنواع أخرى من النصائح أو التوصيات المقدمة أو المعتمدة من TradingView. اقرأ المزيد في شروط الاستخدام.