Trend Identifier
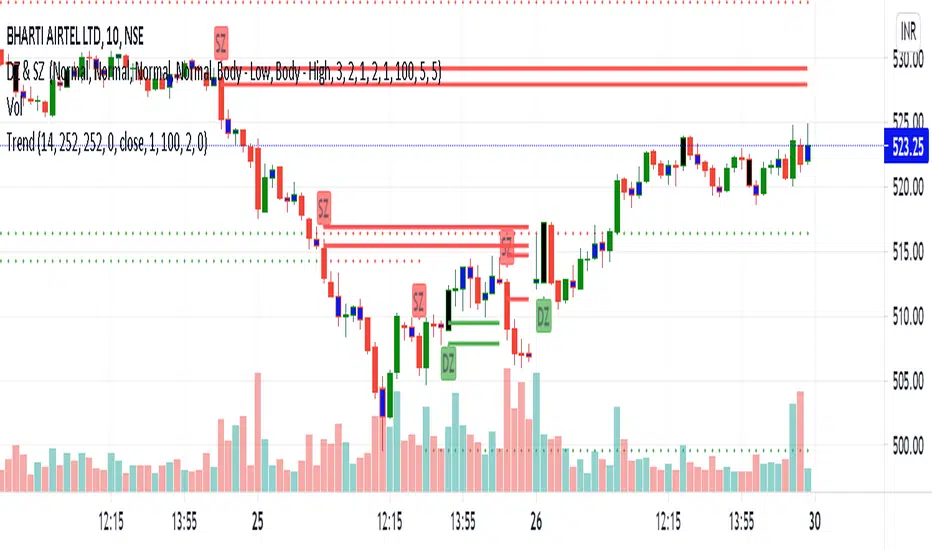
It shows the trend and RSI position for Intraday, Daily and Swing time-frame in one go.
IF RSI is > 70 = RSI High
RSI is < 65 > 35 = RSI Side
RSI is < 30 = RSI Low
For Trend High, Low and Side, it makes it's own calculation and identifies the trend for intermediate time frame.
It also shows the standard deviation information.
1sd = 1 standard deviation achieved.
2sd = 2 standard deviation achieved.
Weekly and Monthly std = Weekly and Monthly standard deviation achieved.
Based on your trading style one can hide the other trend std and RSI option.
PM us to obtain the access.
- Added Pivot support and Resistance which will compliment the Demand and Supply zones.
نص برمجي للمستخدمين المدعوين فقط
يمكن فقط للمستخدمين الذين تمت الموافقة عليهم من قبل المؤلف الوصول إلى هذا البرنامج النصي. ستحتاج إلى طلب الإذن والحصول عليه لاستخدامه. يتم منح هذا عادةً بعد الدفع. لمزيد من التفاصيل، اتبع تعليمات المؤلف أدناه أو اتصل ب SupplyIsInDemand مباشرة.
لا توصي TradingView بالدفع مقابل برنامج نصي أو استخدامه إلا إذا كنت تثق تمامًا في مؤلفه وتفهم كيفية عمله. يمكنك أيضًا العثور على بدائل مجانية ومفتوحة المصدر في نصوص مجتمعنا.
تعليمات المؤلف
إخلاء المسؤولية
نص برمجي للمستخدمين المدعوين فقط
يمكن فقط للمستخدمين الذين تمت الموافقة عليهم من قبل المؤلف الوصول إلى هذا البرنامج النصي. ستحتاج إلى طلب الإذن والحصول عليه لاستخدامه. يتم منح هذا عادةً بعد الدفع. لمزيد من التفاصيل، اتبع تعليمات المؤلف أدناه أو اتصل ب SupplyIsInDemand مباشرة.
لا توصي TradingView بالدفع مقابل برنامج نصي أو استخدامه إلا إذا كنت تثق تمامًا في مؤلفه وتفهم كيفية عمله. يمكنك أيضًا العثور على بدائل مجانية ومفتوحة المصدر في نصوص مجتمعنا.