OPEN-SOURCE SCRIPT
تم تحديثه Bitcoin Pi Cycle Top Indicator - Daily Timeframe Only
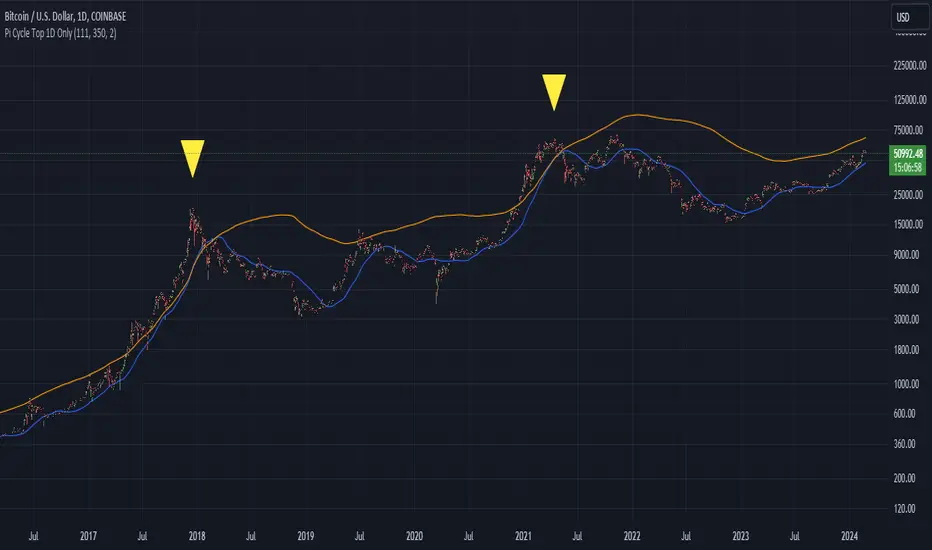
1 Day Timeframe Only
The Bitcoin Pi Cycle Top Indicator has garnered attention for its historical effectiveness in identifying the timing of Bitcoin's market cycle peaks with remarkable precision, typically within a margin of 3 days.
It utilizes a specific combination of moving averages—the 111-day moving average and a 2x multiple of the 350-day moving average—to signal potential tops in the Bitcoin market.
The 111-day moving average (MA): This shorter-term MA is chosen to reflect more recent price action and trends within the Bitcoin market.
The 350-day moving average (MA) multiplied by 2: This longer-term MA is adjusted to capture broader market trends and cycles over an extended period.
The key premise behind the Bitcoin Pi Cycle Top Indicator is that a potential market top for Bitcoin can be signaled when the 111-day MA crosses above the 350-day MA (which has been doubled). Historically, this crossover event has shown a remarkable correlation with the peaks of Bitcoin's price cycles, making it a tool of interest for traders and investors aiming to anticipate significant market shifts.
#Bitcoin
ملاحظات الأخبار
The Bitcoin Pi Cycle Top Indicator has garnered attention for its historical effectiveness in identifying the timing of Bitcoin's market cycle peaks with remarkable precision, typically within a margin of 3 days.It utilizes a specific combination of moving averages—the 111-day moving average and a 2x multiple of the 350-day moving average—to signal potential tops in the Bitcoin market.
The 111-day moving average (MA): This shorter-term MA is chosen to reflect more recent price action and trends within the Bitcoin market.
The 350-day moving average (MA) multiplied by 2: This longer-term MA is adjusted to capture broader market trends and cycles over an extended period.
The key premise behind the Bitcoin Pi Cycle Top Indicator is that a potential market top for Bitcoin can be signaled when the 111-day MA crosses above the 350-day MA (which has been doubled). Historically, this crossover event has shown a remarkable correlation with the peaks of Bitcoin's price cycles, making it a tool of interest for traders and investors aiming to anticipate significant market shifts.
#Bitcoin
نص برمجي مفتوح المصدر
بروح TradingView الحقيقية، قام مبتكر هذا النص البرمجي بجعله مفتوح المصدر، بحيث يمكن للمتداولين مراجعة وظائفه والتحقق منها. شكرا للمؤلف! بينما يمكنك استخدامه مجانًا، تذكر أن إعادة نشر الكود يخضع لقواعد الموقع الخاصة بنا.
إخلاء المسؤولية
لا يُقصد بالمعلومات والمنشورات أن تكون، أو تشكل، أي نصيحة مالية أو استثمارية أو تجارية أو أنواع أخرى من النصائح أو التوصيات المقدمة أو المعتمدة من TradingView. اقرأ المزيد في شروط الاستخدام.