OPEN-SOURCE SCRIPT
Trend Analyzer
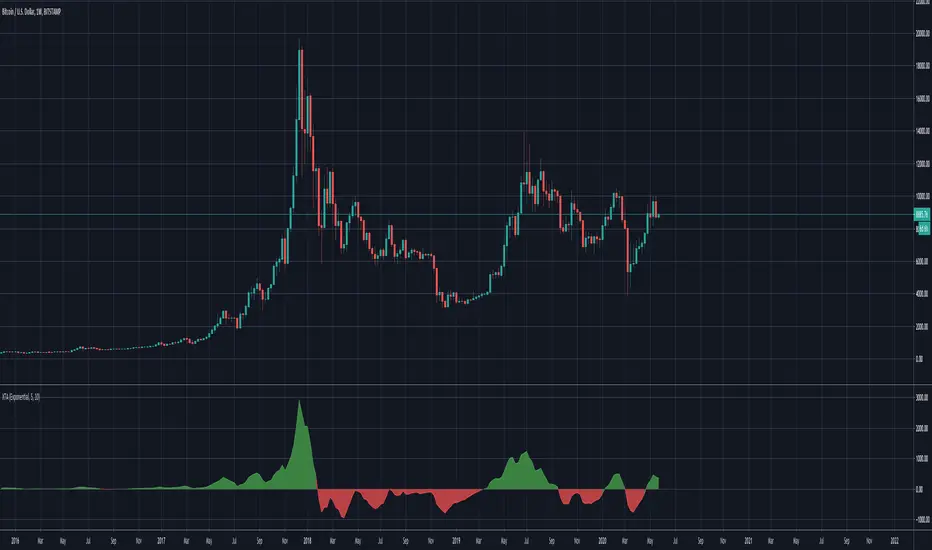
A simple script that plots difference between 2 moving averages and depicts convergance/divergance in color coded format.
Anything <= 0 is red and shows a bearish trend whereas > 0 is green and shows bullish trend.
Adjust the input parameters as following for your preferred time frame :
Anything <= 0 is red and shows a bearish trend whereas > 0 is green and shows bullish trend.
Adjust the input parameters as following for your preferred time frame :
- 4-Hr: Exponential, 15, 30
- Daily: Exponential, 10, 20
- Weekly: Exponential, 5, 10
نص برمجي مفتوح المصدر
بروح TradingView الحقيقية، قام مبتكر هذا النص البرمجي بجعله مفتوح المصدر، بحيث يمكن للمتداولين مراجعة وظائفه والتحقق منها. شكرا للمؤلف! بينما يمكنك استخدامه مجانًا، تذكر أن إعادة نشر الكود يخضع لقواعد الموقع الخاصة بنا.
إخلاء المسؤولية
لا يُقصد بالمعلومات والمنشورات أن تكون، أو تشكل، أي نصيحة مالية أو استثمارية أو تجارية أو أنواع أخرى من النصائح أو التوصيات المقدمة أو المعتمدة من TradingView. اقرأ المزيد في شروط الاستخدام.