OPEN-SOURCE SCRIPT
تم تحديثه 2nd Grade Technique
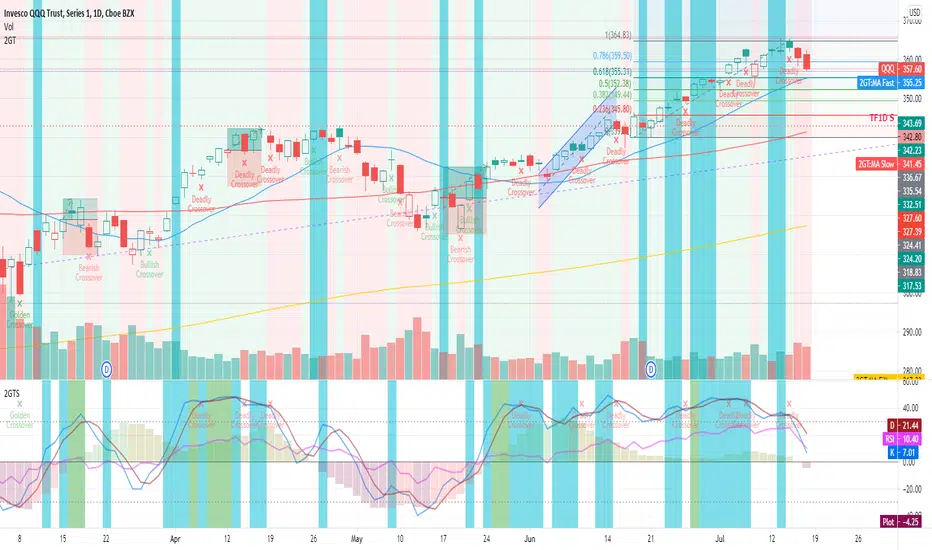
This is comprises of multiple popularly used indicators to help decide on whether to go long or short. This indicator will overlay the MA lines and background colours on your chart.
The heikin-ashi colour will be shown as the background colour. This will help you identify a trend more easily while using bars, candles, hollow candles, etc. When the background is green, it means that it is a green HA and vice versa.
The blue MA line is for showing the short-term trend. The red MA line is for showing the medium-term trend. You can select the moving average flavour of your choice in the settings.
The yellow MA line is the long-term trend that is mainly used as a filter to indicate bullish/bearish trend. The MA type for this filter can be different from the short/mid term MA.
This indicator will also show Stochastic crossovers (GC, DC, BC) on the chart. This will help to always keep your eye on the chart candles.
In the settings, you can also turn on/off bullish/bearish signals.
Rules for bullish signals on this indicator:-
1. MA: Blue > Red > Yellow (FastMA > SlowMA > FilterMA)
2. Stochastic: K > D and both are heading upwards
3. 2nd Green HA
When 2 out of the 3 rules are met, the candle background will be Aqua in colour. When all 3 rules are met, the candle background will be Green.
Rules for bearish signals on this indicator:-
1. MA: Yellow > Red > Blue (FilterMA > SlowMA > FastMA)
2. Stochastic: D > K and both are heading downwards
3. 2nd Red HA
When 2 out of the 3 rules are met, the candle background will be Orange in colour. When all 3 rules are met, the candle background will be Red.
Do note that you can show/hide any of these elements via the settings.
If you find this useful, do smash the LIKE and FOLLOW button.
WSLM
ملاحظات الأخبار
Updated bullish and bearish rules.Bullish:-
1. MA: Current candle above FastMA, Blue > Red > Yellow (FastMA > SlowMA > FilterMA) and all are moving upwards
2. Stochastic: K > D and both are heading upwards
3. 2nd Green HA
When 2 out of the 3 rules are met, the candle background will be Aqua in colour. When all 3 rules are met, the candle background will be Green.
Bearish
1. MA: Current candle below FastMA, Yellow > Red > Blue (FilterMA > SlowMA > FastMA) and all are moving downwards
2. Stochastic: D > K and both are heading downwards
3. 2nd Red HA
When 2 out of the 3 rules are met, the candle background will be Orange in colour. When all 3 rules are met, the candle background will be Red.
نص برمجي مفتوح المصدر
بروح TradingView الحقيقية، قام مبتكر هذا النص البرمجي بجعله مفتوح المصدر، بحيث يمكن للمتداولين مراجعة وظائفه والتحقق منها. شكرا للمؤلف! بينما يمكنك استخدامه مجانًا، تذكر أن إعادة نشر الكود يخضع لقواعد الموقع الخاصة بنا.
إخلاء المسؤولية
لا يُقصد بالمعلومات والمنشورات أن تكون، أو تشكل، أي نصيحة مالية أو استثمارية أو تجارية أو أنواع أخرى من النصائح أو التوصيات المقدمة أو المعتمدة من TradingView. اقرأ المزيد في شروط الاستخدام.