OPEN-SOURCE SCRIPT
Moving Average of Volume for Up and Down Closes
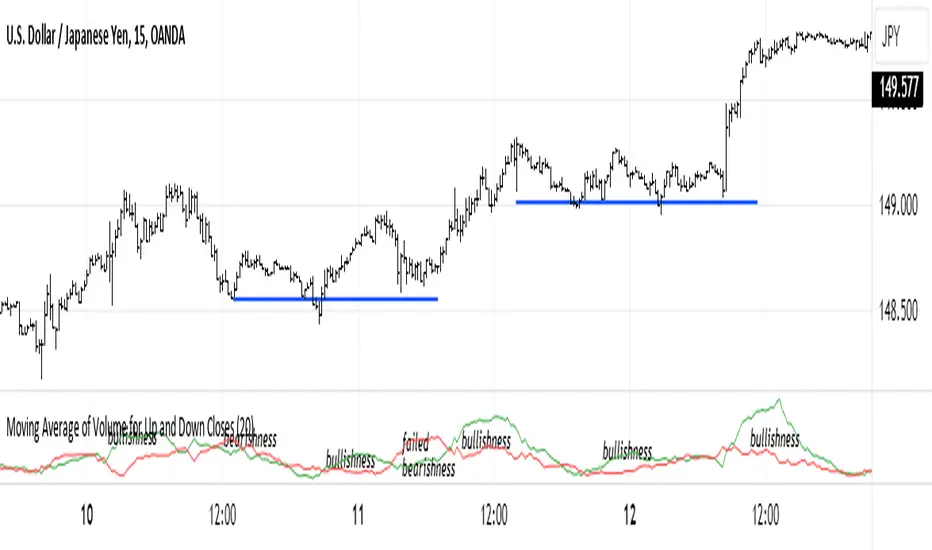
This indicator is intended to provide market bias information at a glance. Depending on the number of periods selected it can help identify changes in buying and selling sentiment or overall market bias. The two lines indicate increases and decreases in volumes for the selected number of periods. I recommend using this indicator with a minimum of clear support and resistance lines and a standard volume indicator. It does provided useful information as a stand-alone indicator. I don't use any indicators except volume, so this was meant to be my own personal volume analysis tool, however I feel that it can be very useful for other traders who may not have a deep understanding of volume analysis.
نص برمجي مفتوح المصدر
بروح TradingView الحقيقية، قام مبتكر هذا النص البرمجي بجعله مفتوح المصدر، بحيث يمكن للمتداولين مراجعة وظائفه والتحقق منها. شكرا للمؤلف! بينما يمكنك استخدامه مجانًا، تذكر أن إعادة نشر الكود يخضع لقواعد الموقع الخاصة بنا.
إخلاء المسؤولية
لا يُقصد بالمعلومات والمنشورات أن تكون، أو تشكل، أي نصيحة مالية أو استثمارية أو تجارية أو أنواع أخرى من النصائح أو التوصيات المقدمة أو المعتمدة من TradingView. اقرأ المزيد في شروط الاستخدام.