OPEN-SOURCE SCRIPT
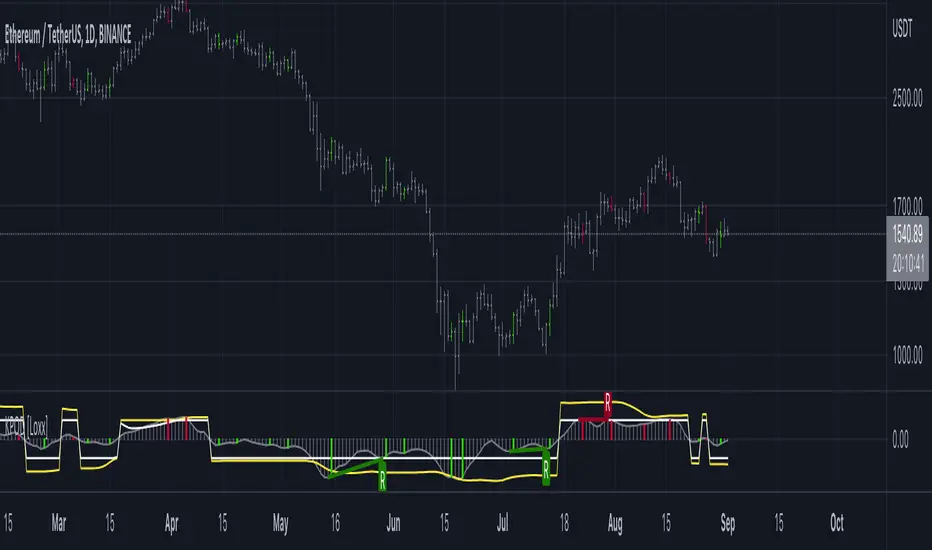
Kase Peak Oscillator w/ Divergences [Loxx]

Kase Peak Oscillator is unique among first derivative or "rate-of-change" indicators in that it statistically evaluates over fifty trend lengths and automatically adapts to both cycle length and volatility. In addition, it replaces the crude linear mathematics of old with logarithmic and exponential models that better reflect the true nature of the market. Kase Peak Oscillator is unique in that it can be applied across multiple time frames and different commodities.
As a hybrid indicator, the Peak Oscillator also generates a trend signal via the crossing of the histogram through the zero line. In addition, the red/green histogram line indicates when the oscillator has reached an extreme condition. When the oscillator reaches this peak and then turns, it means that most of the time the market will turn either at the present extreme, or (more likely) at the following extreme.
This is both a reversal and breakout/breakdown indicator. Crosses above/below zero line can be used for breakouts/breakdowns, while the thick green/red bars can be used to detect reversals
The indicator consists of three indicators:
The PeakOscillator is used two ways:
Included:
As a hybrid indicator, the Peak Oscillator also generates a trend signal via the crossing of the histogram through the zero line. In addition, the red/green histogram line indicates when the oscillator has reached an extreme condition. When the oscillator reaches this peak and then turns, it means that most of the time the market will turn either at the present extreme, or (more likely) at the following extreme.
This is both a reversal and breakout/breakdown indicator. Crosses above/below zero line can be used for breakouts/breakdowns, while the thick green/red bars can be used to detect reversals
The indicator consists of three indicators:
- The PeakOscillator itself is rendered as a gray histogram.
- Max is a red/green solid line within the histogram signifying a market extreme.
- Yellow line is max peak value of two (by default, you can change this with the deviations input settings) standard deviations of the Peak Oscillator value
- White line is the min peak value of two (by default, you can change this with the deviations input settings) standard deviations of the PeakOscillator value
The PeakOscillator is used two ways:
- Divergence: Kase Peak Oscillator may be used to generate traditional divergence signals. The difference between it and traditional divergence indicators lies in its accuracy.
- PeakOut: The second use is to look for a Peak Out. A Peak Out occurs when the histogram breaks beyond the PeakOut line and then pulls back. A Peak Out through the maximum line will be displayed magenta. A Peak Out, which only extends through the Peak Min line is called a local Peak Out, and is less significant than a normal Peak Out signal. These local Peak Outs are to be relied upon more heavily during sideways or corrective markets. Peak Outs may be based on either the maximum line or the minimum line. Maximum Peak Outs, however, are rarer and thus more significant than minimum Peak Outs. The magnitude of the price move may be greater following the maximum Peak Out, but the likelihood of the break in trend is essentially the same. Thus, our research indicates that we should react equally to a Peak Out in a trendy market and a Peak Min in a choppy or corrective market.
Included:
- Bar coloring
- Alerts
نص برمجي مفتوح المصدر
بروح TradingView الحقيقية، قام مبتكر هذا النص البرمجي بجعله مفتوح المصدر، بحيث يمكن للمتداولين مراجعة وظائفه والتحقق منها. شكرا للمؤلف! بينما يمكنك استخدامه مجانًا، تذكر أن إعادة نشر الكود يخضع لقواعد الموقع الخاصة بنا.
Public Telegram Group, t.me/algxtrading_public
VIP Membership Info: patreon.com/algxtrading/membership
VIP Membership Info: patreon.com/algxtrading/membership
إخلاء المسؤولية
لا يُقصد بالمعلومات والمنشورات أن تكون، أو تشكل، أي نصيحة مالية أو استثمارية أو تجارية أو أنواع أخرى من النصائح أو التوصيات المقدمة أو المعتمدة من TradingView. اقرأ المزيد في شروط الاستخدام.