PROTECTED SOURCE SCRIPT
تم تحديثه LuauDesign's Bull & Bear Runs Support and Resistance

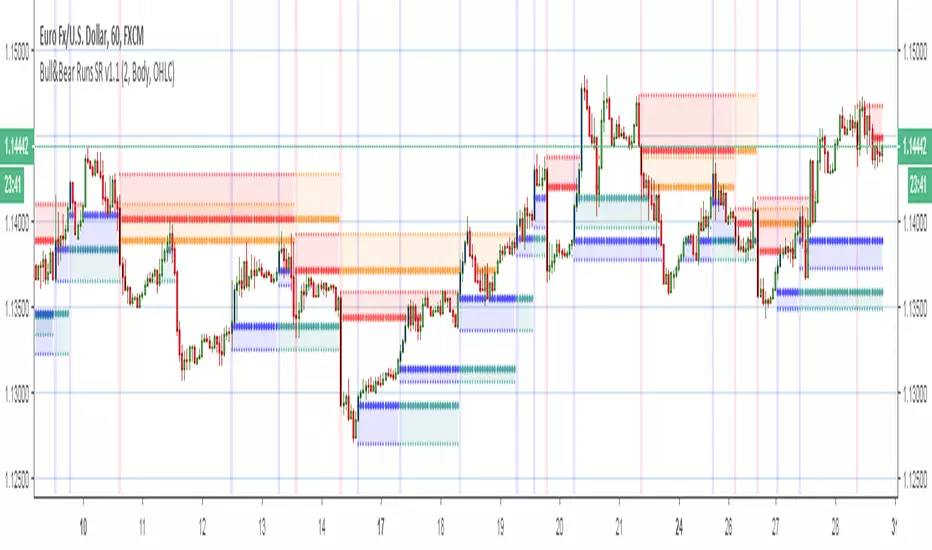
Support and Resistance Zones

This automates the way I look at drawing Support and Resistance. Different settings make it catch different moves.

It isn't perfect. It doesn't spot everything it should. But it spots some stuff it should, and can be tweaked with the different settings to see different things.

The zones are short-lived. They bound once, twice at best, and sometimes he bounce is very weak and quickly overtaken.


Hope this is useful to someone.
This automates the way I look at drawing Support and Resistance. Different settings make it catch different moves.
It isn't perfect. It doesn't spot everything it should. But it spots some stuff it should, and can be tweaked with the different settings to see different things.
The zones are short-lived. They bound once, twice at best, and sometimes he bounce is very weak and quickly overtaken.
Hope this is useful to someone.
ملاحظات الأخبار
The original one had scale defaulting to the left of the chart, and that'd cause problems when more than one indicator was present.I also changed the color of the bullish engulfments from yellow to blue, to keep it consistent with other SR scripts I'm working on.
نص برمجي محمي
تم نشر هذا النص البرمجي كمصدر مغلق. ومع ذلك، يمكنك استخدامه بحرية ودون أي قيود - تعرف على المزيد هنا.
إخلاء المسؤولية
لا يُقصد بالمعلومات والمنشورات أن تكون، أو تشكل، أي نصيحة مالية أو استثمارية أو تجارية أو أنواع أخرى من النصائح أو التوصيات المقدمة أو المعتمدة من TradingView. اقرأ المزيد في شروط الاستخدام.