OPEN-SOURCE SCRIPT
Strat Assistant FTC Only

Strat Assistant FTC Only
----------------------------
█ OVERVIEW
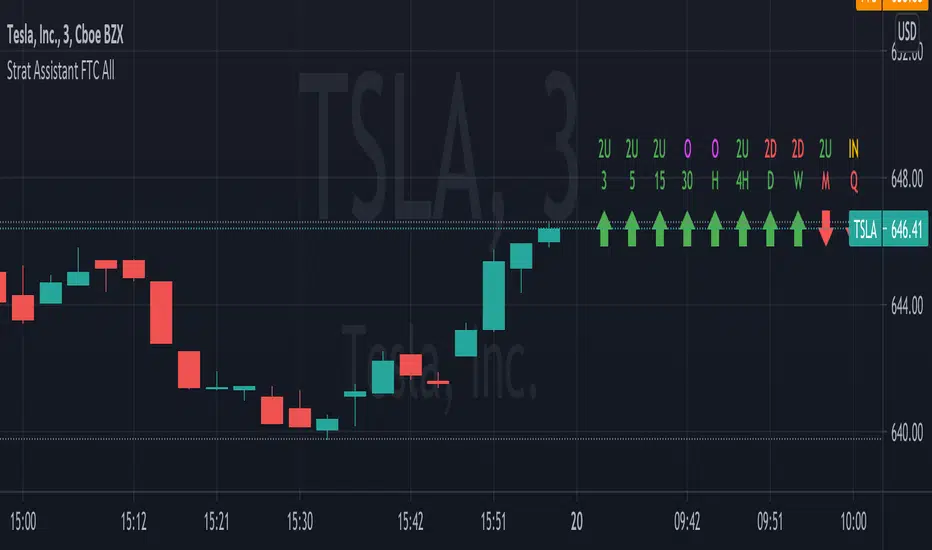
This script is intended to provide full time frame continuity information for almost all time frames (3, 5, 15, 30, 60, 4H, Day, Week, Month, Quarter)
When added, the script provides a visual indicator to the right at the current price level with indicators for the various time frames in terms of price action and candle type.
█ DETAIL
----------
Output
- Time Frames: 3min, 5min, 15min, 30min, 60min, 4 Hour, Day, Week, Month Quarter
- Time Frame Labels: 3, 5, 15, 30, 60, H, 4H, D, W, M, Q
- Current Candle Time Frame Price Action: displayed below time frame labels. RED + Arrow Down (open > close) or GREEN + Arrow Up (open =< close)
- Time Frame Compare: displayed above time frame labels. Current high/low vs prior high/low are compared. IN = Inside/Yellow (current high/low inside prior), O = Outside/Fuchsia (current high/low both greater and less than prior high/low), 2U = Up/Green (current high higher than prior, and low not lower), 2D = Down/Red (current lows lower than prior lows, and high not higher)
- Will not show time frames lower than the one currently selected
Best Practices
---------- - Had to decouple this from the other scripts because Trading View limits how much you can plot/show
- May be a little slow at times, analyzing a lot of time periods/data be patient.
نص برمجي مفتوح المصدر
بروح TradingView الحقيقية، قام مبتكر هذا النص البرمجي بجعله مفتوح المصدر، بحيث يمكن للمتداولين مراجعة وظائفه والتحقق منها. شكرا للمؤلف! بينما يمكنك استخدامه مجانًا، تذكر أن إعادة نشر الكود يخضع لقواعد الموقع الخاصة بنا.
إخلاء المسؤولية
لا يُقصد بالمعلومات والمنشورات أن تكون، أو تشكل، أي نصيحة مالية أو استثمارية أو تجارية أو أنواع أخرى من النصائح أو التوصيات المقدمة أو المعتمدة من TradingView. اقرأ المزيد في شروط الاستخدام.