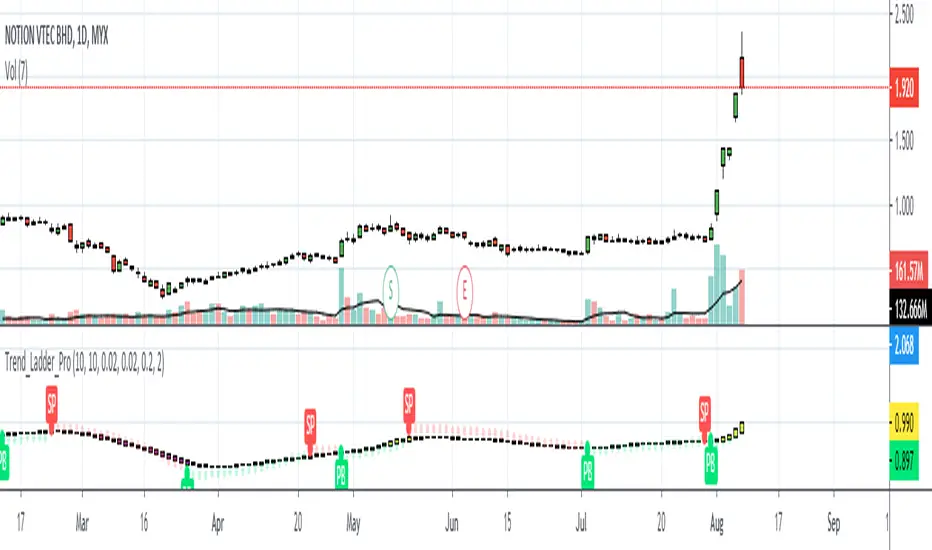
Trend Ladder Pro

Detail Explanation:
1. Purple Ladder
- Indicate that the market share is in a bearish trend. The ladder is heikin ashi candle which gives the smoother and uninterrupted downtrend.
2. Yellow Ladder
- Indicate that the market share is in a bullish trend. The ladder is heikin ashi candle which gives the smoother and uninterrupted uptrend.
3. Selling Pressure(SP)
- This signal shows that the selling pressure starting to take over the market shares. It appear when the first dot triggered to warn the traders from entering the market share or to take profit if they already holding position.
4. Pullback(PB)
- This signal shows that traders starting to have an interest in the market shares and having a pullback signal. It appear when the first dot triggered to alert the traders so that the market share can be put in the watchlist.
5. Red and Green Dot
- These dots are Parabolic SAR with the default setting but custom colors depending on the user interest. The dots are below as the price moving uptrend and above when the price downtrend. However, during sideways there will be a lot of false signals.
Contact me if you want to try the indicator.
نص برمجي للمستخدمين المدعوين فقط
يمكن فقط للمستخدمين الذين تمت الموافقة عليهم من قبل المؤلف الوصول إلى هذا البرنامج النصي. ستحتاج إلى طلب الإذن والحصول عليه لاستخدامه. يتم منح هذا عادةً بعد الدفع. لمزيد من التفاصيل، اتبع تعليمات المؤلف أدناه أو اتصل ب Trader_Cenonet مباشرة.
لا توصي TradingView بالدفع مقابل برنامج نصي أو استخدامه إلا إذا كنت تثق تمامًا في مؤلفه وتفهم كيفية عمله. يمكنك أيضًا العثور على بدائل مجانية ومفتوحة المصدر في نصوص مجتمعنا.
تعليمات المؤلف
إخلاء المسؤولية
نص برمجي للمستخدمين المدعوين فقط
يمكن فقط للمستخدمين الذين تمت الموافقة عليهم من قبل المؤلف الوصول إلى هذا البرنامج النصي. ستحتاج إلى طلب الإذن والحصول عليه لاستخدامه. يتم منح هذا عادةً بعد الدفع. لمزيد من التفاصيل، اتبع تعليمات المؤلف أدناه أو اتصل ب Trader_Cenonet مباشرة.
لا توصي TradingView بالدفع مقابل برنامج نصي أو استخدامه إلا إذا كنت تثق تمامًا في مؤلفه وتفهم كيفية عمله. يمكنك أيضًا العثور على بدائل مجانية ومفتوحة المصدر في نصوص مجتمعنا.