OPEN-SOURCE SCRIPT
تم تحديثه Horizontal Lines from Current Price
This indicator will help traders track price fluctuations in smaller time frames more conveniently than ever before.
Here's how it works:
Additionally, we also provide volume display (measured in USD) at the current candle position to assist traders in keeping track of market momentum more closely.
Installation guide for indicators:
Here's how it works:
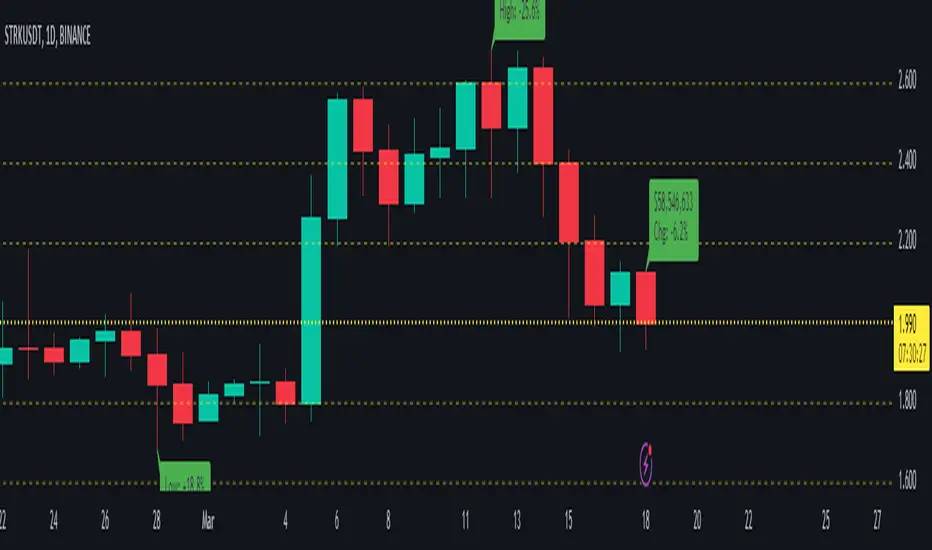
Starting from the current price, the indicator will draw horizontal lines spaced 10% apart.
Now, whenever zooming in or out of the chart, traders can visually determine the level of price volatility more easily.
Additionally, we also provide volume display (measured in USD) at the current candle position to assist traders in keeping track of market momentum more closely.
Installation guide for indicators:
After installing the indicator, make sure that the indicator is merged with the price chart.
Secondly, ensure that the scale bar of the indicator merges with the scale bar of the price chart.
ملاحظات الأخبار
Update default inputsملاحظات الأخبار
Clean source code & Inputsملاحظات الأخبار
➕ Added the feature to view the highest and lowest price changes of the current bar compared to the previous bars.⚡⚡⚡ملاحظات الأخبار
Clean source code 🚧🚧🚧ملاحظات الأخبار
➕ Added the feature to view the changes in the current price bar.⚡⚡⚡ملاحظات الأخبار
Clean source code 🚧🚧🚧ملاحظات الأخبار
Update display current price 🚧🚧🚧ملاحظات الأخبار
Fix bug 🚧🚧🚧ملاحظات الأخبار
Fix bug 🚧🚧🚧ملاحظات الأخبار
Fix bug 🚧🚧🚧ملاحظات الأخبار
Fix bug 🚧🚧🚧ملاحظات الأخبار
Fix bug 🚧🚧🚧ملاحظات الأخبار
Fix bug 🚧🚧🚧ملاحظات الأخبار
Fix bug 🚧🚧🚧نص برمجي مفتوح المصدر
بروح TradingView الحقيقية، قام مبتكر هذا النص البرمجي بجعله مفتوح المصدر، بحيث يمكن للمتداولين مراجعة وظائفه والتحقق منها. شكرا للمؤلف! بينما يمكنك استخدامه مجانًا، تذكر أن إعادة نشر الكود يخضع لقواعد الموقع الخاصة بنا.
إخلاء المسؤولية
لا يُقصد بالمعلومات والمنشورات أن تكون، أو تشكل، أي نصيحة مالية أو استثمارية أو تجارية أو أنواع أخرى من النصائح أو التوصيات المقدمة أو المعتمدة من TradingView. اقرأ المزيد في شروط الاستخدام.
نص برمجي مفتوح المصدر
بروح TradingView الحقيقية، قام مبتكر هذا النص البرمجي بجعله مفتوح المصدر، بحيث يمكن للمتداولين مراجعة وظائفه والتحقق منها. شكرا للمؤلف! بينما يمكنك استخدامه مجانًا، تذكر أن إعادة نشر الكود يخضع لقواعد الموقع الخاصة بنا.
إخلاء المسؤولية
لا يُقصد بالمعلومات والمنشورات أن تكون، أو تشكل، أي نصيحة مالية أو استثمارية أو تجارية أو أنواع أخرى من النصائح أو التوصيات المقدمة أو المعتمدة من TradingView. اقرأ المزيد في شروط الاستخدام.