OPEN-SOURCE SCRIPT
تم تحديثه Multi-Indicator by johntradingwick
The Multi-Indicator includes the functionality of the following indicators:
1. Market Structure
2. Support and Resistance
3. VWAP
4. Simple Moving Average
5. Exponential Moving Average
Functionality of the Multi-Indicator:
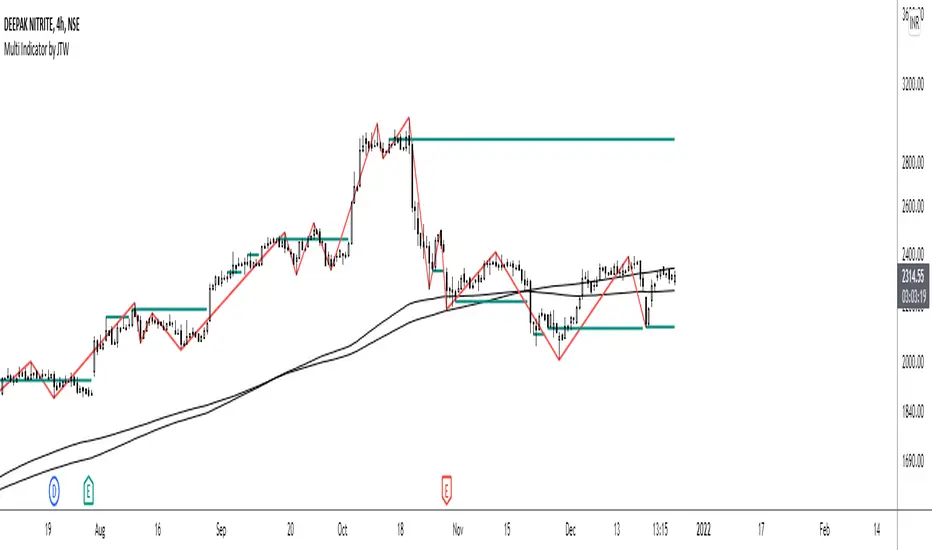
Market Structure
As we already know, the market structure is one of the most important things in trading. If we are able to identify the trend correctly, it takes away a huge burden. For this, I have used the Zig Zag indicator to identify price trends. It plots points on the chart whenever the prices reverse by a larger percentage than a predetermined variable. The points are then connected by straight lines that will help you to identify the swing high and low.
This will help you to filter out any small price movements, making it easier to identify the trend, its direction, and its strength levels. You can change the period in consideration and the deviation by changing the deviation % and the depth.

Support and Resistance
The indicator provides the functionality to add support and resistance levels. If you want more levels just change the timeframe it looks at in the settings. It will pull the SR levels off the timeframe specified in the settings.
You can select the timeframe for support and resistance levels. The default time frame is “same as the chart”.
You can also extend lines to the right and change the width and colour of the lines. There is also an option to change the criteria to select the lines as valid support or resistance. You can extend the S/R level or use the horizontal lines to mark the level when there is a change in polarity.

VWAP
Volume Weighted Average Price (VWAP) is used to measure the average price weighted by volume. VWAP is typically used with intraday charts as a way to determine the general direction of intraday prices. It's similar to a moving average in that when the price is above VWAP, prices are rising and when the price is below VWAP, prices are falling. VWAP is primarily used by technical analysts to identify market trend.
Simple Moving Average
A simple Moving Average is an unweighted Moving Average. This means that each day in the data set has equal importance and is weighted equally. As each new day ends, the oldest data point is dropped and the newest one is added to the beginning.
The multi-indicator has the ability to provide 5 moving averages. This is particularly helpful if you want to use various time periods such as 20, 50, 100, and 200. Although this is just basic functionality, it comes in handy if you are using a free account.
Exponential Moving Average
An exponential moving average (EMA) is a type of moving average (MA) that places a greater weight and significance on the most recent data points. An exponentially weighted moving average reacts more significantly to recent price changes than a simple moving average. The multi-indicator provides 5 exponential moving averages. This is particularly helpful if you want to use various time periods such as 20, 50, 100, and 200.
1. Market Structure
2. Support and Resistance
3. VWAP
4. Simple Moving Average
5. Exponential Moving Average
Functionality of the Multi-Indicator:
Market Structure
As we already know, the market structure is one of the most important things in trading. If we are able to identify the trend correctly, it takes away a huge burden. For this, I have used the Zig Zag indicator to identify price trends. It plots points on the chart whenever the prices reverse by a larger percentage than a predetermined variable. The points are then connected by straight lines that will help you to identify the swing high and low.
This will help you to filter out any small price movements, making it easier to identify the trend, its direction, and its strength levels. You can change the period in consideration and the deviation by changing the deviation % and the depth.
Support and Resistance
The indicator provides the functionality to add support and resistance levels. If you want more levels just change the timeframe it looks at in the settings. It will pull the SR levels off the timeframe specified in the settings.
You can select the timeframe for support and resistance levels. The default time frame is “same as the chart”.
You can also extend lines to the right and change the width and colour of the lines. There is also an option to change the criteria to select the lines as valid support or resistance. You can extend the S/R level or use the horizontal lines to mark the level when there is a change in polarity.
VWAP
Volume Weighted Average Price (VWAP) is used to measure the average price weighted by volume. VWAP is typically used with intraday charts as a way to determine the general direction of intraday prices. It's similar to a moving average in that when the price is above VWAP, prices are rising and when the price is below VWAP, prices are falling. VWAP is primarily used by technical analysts to identify market trend.
Simple Moving Average
A simple Moving Average is an unweighted Moving Average. This means that each day in the data set has equal importance and is weighted equally. As each new day ends, the oldest data point is dropped and the newest one is added to the beginning.
The multi-indicator has the ability to provide 5 moving averages. This is particularly helpful if you want to use various time periods such as 20, 50, 100, and 200. Although this is just basic functionality, it comes in handy if you are using a free account.
Exponential Moving Average
An exponential moving average (EMA) is a type of moving average (MA) that places a greater weight and significance on the most recent data points. An exponentially weighted moving average reacts more significantly to recent price changes than a simple moving average. The multi-indicator provides 5 exponential moving averages. This is particularly helpful if you want to use various time periods such as 20, 50, 100, and 200.
ملاحظات الأخبار
Update: Minor fixes ملاحظات الأخبار
Update: Minor fixesملاحظات الأخبار
Added Bollinger Bandsنص برمجي مفتوح المصدر
بروح TradingView الحقيقية، قام مبتكر هذا النص البرمجي بجعله مفتوح المصدر، بحيث يمكن للمتداولين مراجعة وظائفه والتحقق منها. شكرا للمؤلف! بينما يمكنك استخدامه مجانًا، تذكر أن إعادة نشر الكود يخضع لقواعد الموقع الخاصة بنا.
I build communities where traders feel understood and supported. 🔥
Trading is lonely, but it doesn’t have to be.
Want to grow with people who get it?
📈 Join my FREE Telegram → t.me/johntradingwick
🤝 Connect on Twitter → x.com/tradingwick_
Trading is lonely, but it doesn’t have to be.
Want to grow with people who get it?
📈 Join my FREE Telegram → t.me/johntradingwick
🤝 Connect on Twitter → x.com/tradingwick_
إخلاء المسؤولية
لا يُقصد بالمعلومات والمنشورات أن تكون، أو تشكل، أي نصيحة مالية أو استثمارية أو تجارية أو أنواع أخرى من النصائح أو التوصيات المقدمة أو المعتمدة من TradingView. اقرأ المزيد في شروط الاستخدام.
نص برمجي مفتوح المصدر
بروح TradingView الحقيقية، قام مبتكر هذا النص البرمجي بجعله مفتوح المصدر، بحيث يمكن للمتداولين مراجعة وظائفه والتحقق منها. شكرا للمؤلف! بينما يمكنك استخدامه مجانًا، تذكر أن إعادة نشر الكود يخضع لقواعد الموقع الخاصة بنا.
I build communities where traders feel understood and supported. 🔥
Trading is lonely, but it doesn’t have to be.
Want to grow with people who get it?
📈 Join my FREE Telegram → t.me/johntradingwick
🤝 Connect on Twitter → x.com/tradingwick_
Trading is lonely, but it doesn’t have to be.
Want to grow with people who get it?
📈 Join my FREE Telegram → t.me/johntradingwick
🤝 Connect on Twitter → x.com/tradingwick_
إخلاء المسؤولية
لا يُقصد بالمعلومات والمنشورات أن تكون، أو تشكل، أي نصيحة مالية أو استثمارية أو تجارية أو أنواع أخرى من النصائح أو التوصيات المقدمة أو المعتمدة من TradingView. اقرأ المزيد في شروط الاستخدام.