PROTECTED SOURCE SCRIPT
تم تحديثه 3D-WAVE-PM indicator
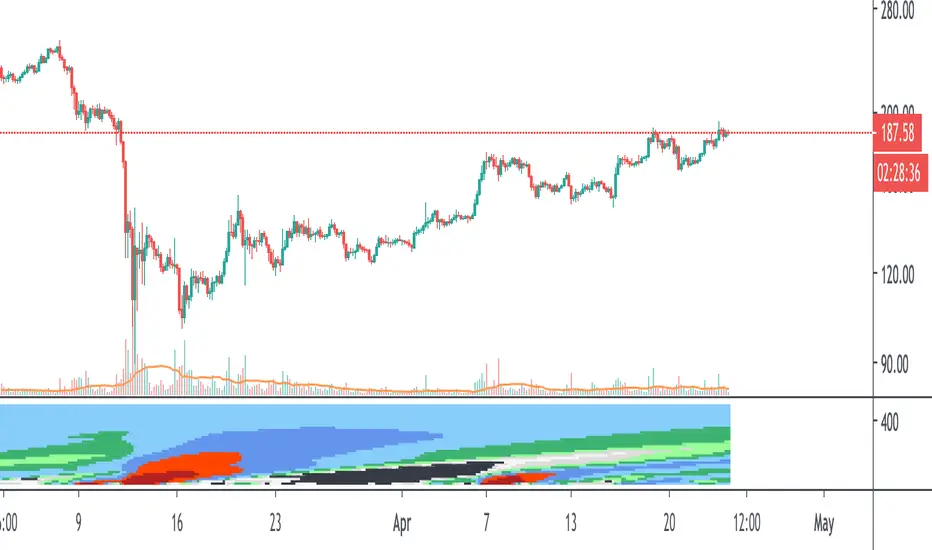
This is an extension of the WAVE-PM indicator as explained by Mark Whistler in his book Volatility Illuminated.
This heatmap represent different lengths of WAVE-PM indicator, starting from 20 and incremented by 15 until 485.
As a reminder, WAVE-PM compare the size of the current distribution to the last 100.
The result is represented as a number between 0 and 1.
The more close to 0, the more contracted the distribution is.
The more close to 1, the more expanded the distribution is.
The color code is the same as my standard WAVE-PM indicator :
Between 0.35 and 0.5 also known as the "Gear change" level => Grey
Between 0.5 and 0.7 also known as the "Consolidation" level => Green
Between 0.7 and 0.9 also known as the "Breakout" level => Blue
Between 0.9 and 1 also known as the "Danger" level => Red
Note that i have colored results below 0.35 as black
Note also that each level has been divided in 2 colors : The light one for the lower half of the range and the dark one for the higher half.
You should resize the indicator window to have a clear and continuous heatmap.
ملاحظات الأخبار
- Updated to pinescript v4نص برمجي محمي
تم نشر هذا النص البرمجي كمصدر مغلق. ومع ذلك، يمكنك استخدامه بحرية ودون أي قيود - تعرف على المزيد هنا.
إخلاء المسؤولية
لا يُقصد بالمعلومات والمنشورات أن تكون، أو تشكل، أي نصيحة مالية أو استثمارية أو تجارية أو أنواع أخرى من النصائح أو التوصيات المقدمة أو المعتمدة من TradingView. اقرأ المزيد في شروط الاستخدام.
نص برمجي محمي
تم نشر هذا النص البرمجي كمصدر مغلق. ومع ذلك، يمكنك استخدامه بحرية ودون أي قيود - تعرف على المزيد هنا.
إخلاء المسؤولية
لا يُقصد بالمعلومات والمنشورات أن تكون، أو تشكل، أي نصيحة مالية أو استثمارية أو تجارية أو أنواع أخرى من النصائح أو التوصيات المقدمة أو المعتمدة من TradingView. اقرأ المزيد في شروط الاستخدام.