PROTECTED SOURCE SCRIPT
تم تحديثه Double Purge Theory (DPT)

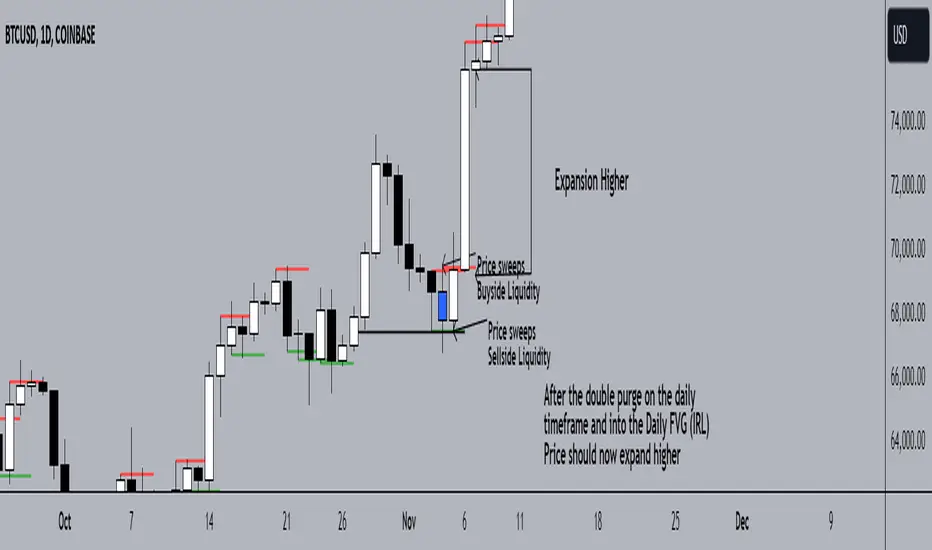
The purpose of this script is to identify the Double Purge Theory-MMXM i.e. the run on liquidity on both the sell-side and the buy-side liquidity.
The simple use case behind this script is to provide additional entry confluence for your trade setups and more efficient stop loss placement on any given timeframe.
DPT in itself is a price signature that generally occurs before price makes impulsive move in the direction of the higher time frame narrative. It is not to be used as a standalone indicator for building narrative/framing bias.
How to use this script ?
1) Wait for the indicator to display the BLUE CANDLE highlight (DPT candle) that indicates the double purge has occurred. [the color is set to blue by default , you can change it by going into the settings tab]
2) The DPT should occur at/after price has tapped into a key level and is within the ICT killzones.
3) Position to frame your trade setup once you get a candle with a body close below / above the DPT candle , depending on your bias and stop loss placement at DPT candle high/low or after the body closure as mentioned in step 2.
For example :
https://www.tradingview.com/x/mqPFuDQ9/
https://www.tradingview.com/x/GqMZfv7O/
ملاحظات الأخبار
What is new in DPT V2 update : 1) Added alerts for DPT, now you can set alerts to go off whenever DPT occurs :
Go to TradingView and open your chart.
Click on the "Alerts" icon (🔔) in the top panel.
Click "Create Alert".
In the Condition dropdown, select the DPT indicator.
Choose "Any alert function call".
Select alert frequency (e.g., once per bar).
Set your preferred notification method (popup, email, webhook, etc.).
Click Create.
2) Bias selection :
This will let users select the sweep they want to filter , if a user selects bullish bias , only bullish sweeps will be shown and if user selects bearish bias then, only bearish sweep shall be shown.
You still have the option to view both.
ملاحظات الأخبار
1) Added time filter to only detect and show DPTs during the time range user specifies. 2) The sweeps logic has been changed to show only the sweep of DPT candle based on stats.
ملاحظات الأخبار
Time Filtering : i) Optional time-based filtering (EST time zone).
ii) Two customizable time slots.
iii) Default slots: 2-5 AM & 8-11 AM EST (can be disabled to capture 24/7 sweeps).
Visual Elements
i) Blue candles (color set by default) = DPT pattern detected
ii) Colored lines = Sweep levels (customizable length, color, style, thickness).
iii) Probability labels = Shows success rate at each sweep.
iv) Statistics table = Real-time performance metrics.
Probability Labels
🟢 Green = >51% success rate (high probability)
🟠 Orange = 40-51% success rate (medium)
🔴 Red = <40% success rate (low probability)
Only shows after minimum sample size reached.
Updates in real-time with historical data.
Statistics Table
Displays:
Bullish sweep success rate
Bearish sweep success rate
Overall success rate
Sample size (total sweeps analyzed)
Color-coded percentages (Green/Orange/Red)
Fully customizable position, size, colors, transparency
Show/hide probability labels
Size options (Tiny/Small/Normal/Large)
Minimum sample size threshold (default: 10)
Auto color-coding based on performance
Time Filter
ملاحظات الأخبار
Fixed bug which was breaking stats when time filter was on but slot 1 was disabled. ملاحظات الأخبار
Removed Stats tableSweeps will retain probability labels
Added alerts for when
i) DPT candle is detected
ii) Sweep of DPT candle
ملاحظات الأخبار
Added more information to probability labels ملاحظات الأخبار
Removed probability and stats since it was not providing meaningful edgeملاحظات الأخبار
Bug fixesنص برمجي محمي
تم نشر هذا النص البرمجي كمصدر مغلق. ومع ذلك، يمكنك استخدامه بحرية ودون أي قيود - تعرف على المزيد هنا.
إخلاء المسؤولية
لا يُقصد بالمعلومات والمنشورات أن تكون، أو تشكل، أي نصيحة مالية أو استثمارية أو تجارية أو أنواع أخرى من النصائح أو التوصيات المقدمة أو المعتمدة من TradingView. اقرأ المزيد في شروط الاستخدام.
نص برمجي محمي
تم نشر هذا النص البرمجي كمصدر مغلق. ومع ذلك، يمكنك استخدامه بحرية ودون أي قيود - تعرف على المزيد هنا.
إخلاء المسؤولية
لا يُقصد بالمعلومات والمنشورات أن تكون، أو تشكل، أي نصيحة مالية أو استثمارية أو تجارية أو أنواع أخرى من النصائح أو التوصيات المقدمة أو المعتمدة من TradingView. اقرأ المزيد في شروط الاستخدام.