OPEN-SOURCE SCRIPT
Defu_Divergence
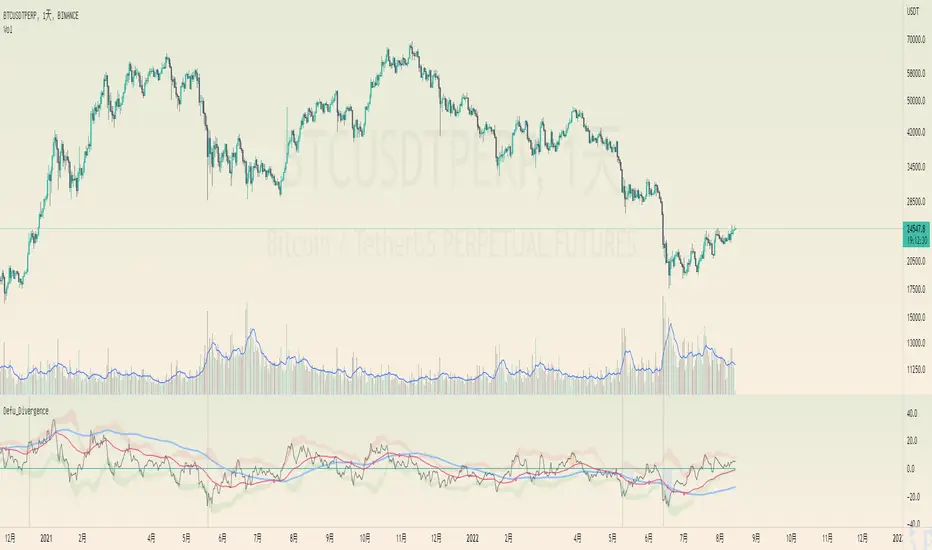
This is a composite indicator, a collection of multiple indicators
It includes the following:
1. the gray background has a huge trading volume ,
2. the market cost deviates, and the relationship between the closing price of the black line, the red line and the blue line and the short-term, medium-term and long-term average. Compare the difference after mutual subtraction.
3. blue orange column fund flow indicator MFI , color transparency indicates the value
4. the Bollinger belt signals with a short deviation rate, which is the Bollinger belt with a black line.
======================The above translation is from Google
这是一个复合指标,集合了多种指标
包括以下:
1.灰色背景成交量巨大,
2.市场成本乖离 ,黑色线、红色线、蓝色线收盘价与 短期 、中期、长期三条均线之间的关系。互减后比较差值。
3.蓝橙柱 资金流量指标MFI,颜色的透明度表示值的大小
4.布林带 以短期乖离率信号,就是黑色线的布林带。
نص برمجي مفتوح المصدر
بروح TradingView الحقيقية، قام مبتكر هذا النص البرمجي بجعله مفتوح المصدر، بحيث يمكن للمتداولين مراجعة وظائفه والتحقق منها. شكرا للمؤلف! بينما يمكنك استخدامه مجانًا، تذكر أن إعادة نشر الكود يخضع لقواعد الموقع الخاصة بنا.
إخلاء المسؤولية
لا يُقصد بالمعلومات والمنشورات أن تكون، أو تشكل، أي نصيحة مالية أو استثمارية أو تجارية أو أنواع أخرى من النصائح أو التوصيات المقدمة أو المعتمدة من TradingView. اقرأ المزيد في شروط الاستخدام.