OPEN-SOURCE SCRIPT
Financial Volume
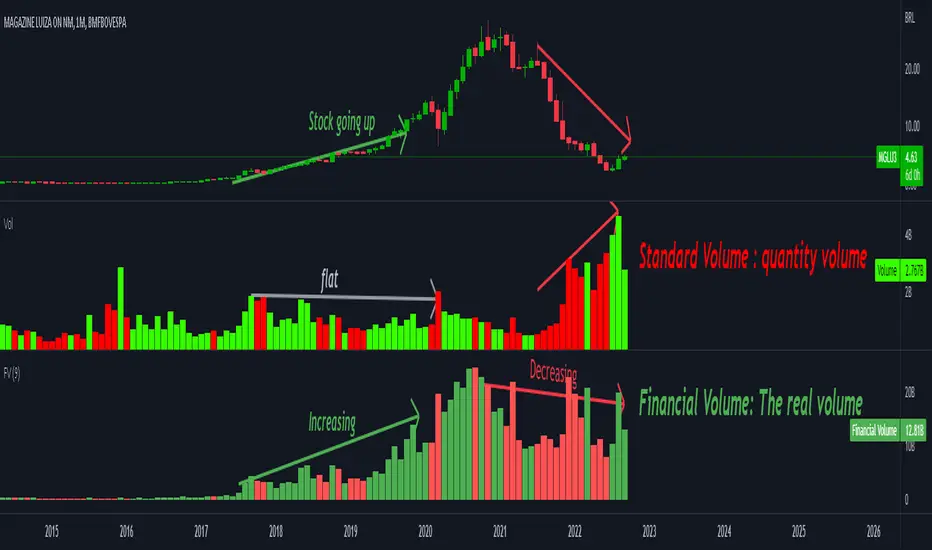
Financial Volume is the quantity of a certain asset traded mutiplied by its price. In other others, it's the amount of money traded for that particular asset.
TradingView uses the "quantity" volume as standard (for a good reason) and actually there is no "right" volume but the quantity volume alone might give the wrong idea.
In the shown example the stock crashed from 20's to below 2 brl. Since it got cheaper, it became easier to trade it and the quantity volume increased. But the amount of of money traded actually decreased, indicating less interest from the market.
Also back in the stock's golden age, the quantity volume stayed flat but the amount of money was actually increasing indicating the market was more interested in that stock.
نص برمجي مفتوح المصدر
بروح TradingView الحقيقية، قام مبتكر هذا النص البرمجي بجعله مفتوح المصدر، بحيث يمكن للمتداولين مراجعة وظائفه والتحقق منها. شكرا للمؤلف! بينما يمكنك استخدامه مجانًا، تذكر أن إعادة نشر الكود يخضع لقواعد الموقع الخاصة بنا.
إخلاء المسؤولية
لا يُقصد بالمعلومات والمنشورات أن تكون، أو تشكل، أي نصيحة مالية أو استثمارية أو تجارية أو أنواع أخرى من النصائح أو التوصيات المقدمة أو المعتمدة من TradingView. اقرأ المزيد في شروط الاستخدام.