OPEN-SOURCE SCRIPT
NASDAQ Trading System with Pivots
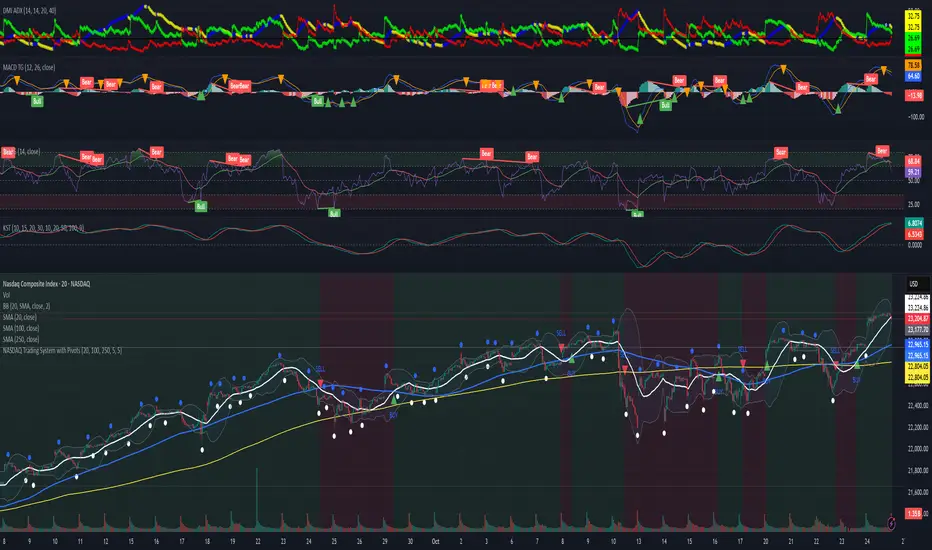
This TradingView indicator, designed for the 30-minute NASDAQ (^IXIC) chart, guides QQQ options trading using a trend-following strategy. It plots a 20-period SMA (blue) and a 100-period SMA (red), with an optional 250-period SMA (orange) inspired by rauItrades' NASDAQ SMA outfit. A bullish crossover (20 SMA > 100 SMA) triggers a green "BUY" triangle below the bar, signaling a potential long position in QQQ, while a bearish crossunder (20 SMA < 100 SMA) shows a red "SELL" triangle above, indicating a short or exit. The background colors green (bullish) or red (bearish) for trend bias. Orange circles (recent highs) and purple circles (recent lows) mark support/resistance levels using 5-bar pivot points.
نص برمجي مفتوح المصدر
بروح TradingView الحقيقية، قام مبتكر هذا النص البرمجي بجعله مفتوح المصدر، بحيث يمكن للمتداولين مراجعة وظائفه والتحقق منها. شكرا للمؤلف! بينما يمكنك استخدامه مجانًا، تذكر أن إعادة نشر الكود يخضع لقواعد الموقع الخاصة بنا.
إخلاء المسؤولية
لا يُقصد بالمعلومات والمنشورات أن تكون، أو تشكل، أي نصيحة مالية أو استثمارية أو تجارية أو أنواع أخرى من النصائح أو التوصيات المقدمة أو المعتمدة من TradingView. اقرأ المزيد في شروط الاستخدام.